SMS surveys typically generate the highest response rates, often ranging between 45% and 60%, due to their immediacy and low participation effort.
WhatsApp surveys are rapidly emerging as a high-engagement feedback channel, particularly in mobile-first markets and BFSI customer journeys.
In-app surveys frequently outperform email because feedback is collected while customers are actively engaged in the experience being measured.
Traditional email surveys usually generate lower response rates, but they remain valuable for relationship surveys, detailed feedback, and long-form responses.
IVR and phone surveys continue to play an important role in service-heavy and regulated industries where immediate post-interaction feedback is critical.
The best survey channel is not necessarily the one with the highest response rate; it is the one that fits the customer's journey stage, communication preference, and accessibility context.
Response-rate benchmarks should be treated as directional guidance, not channel-selection rules.
Organizations that align survey channels with customer behavior and journey moments typically collect more representative feedback and reduce survey fatigue.
Modern CX leaders increasingly use multi-channel Voice of Customer (VoC) programs that combine SMS, WhatsApp, in-app, email, IVR, and passive feedback mechanisms to improve insight quality.
The goal is not maximizing survey responses. The goal is capturing the most accurate, actionable, and representative customer signal.
How CX Metrics Drive Revenue, Loyalty, and Competitive Advantage in Everyday Commerce and at the Moments That Define Brand Trust?
At NUMR, we believe that CX metrics are only useful when they connect directly to business outcomes. The number of organisations that measure satisfaction without knowing whether that satisfaction is generating revenue, reducing churn, or protecting margin is, frankly, the majority.
This study is about the inverse problem, two of the most powerful brands in global commerce, Visa and Mastercard, whose CX outcomes are massive, computable, and deeply consequential, but whose measurement posture is almost entirely opaque to the outside world.
That opacity is not an accident. It is a strategic choice. And it has a cost.
This study is NUMR's analytical reconstruction of what we can know, what we can reasonably infer, and what the Visa-vs-Mastercard CX comparison teaches leaders in financial services, retail, and any high-volume, high-stakes customer environment about the relationship between CX metrics and the business outcomes that fund growth. We use FIFA World Cup 2026 and the Paris 2024 Olympics as diagnostic stress events when payment CX becomes visible, emotional, and commercially pivotal in a way that normal-times dashboards do not capture.
Read this as a CX strategy lens, not a brand ranking. The real question is not which network wins.
It is: what does their competitive dynamic teach you about measuring and managing CX in your own organisation?
Executive Thesis
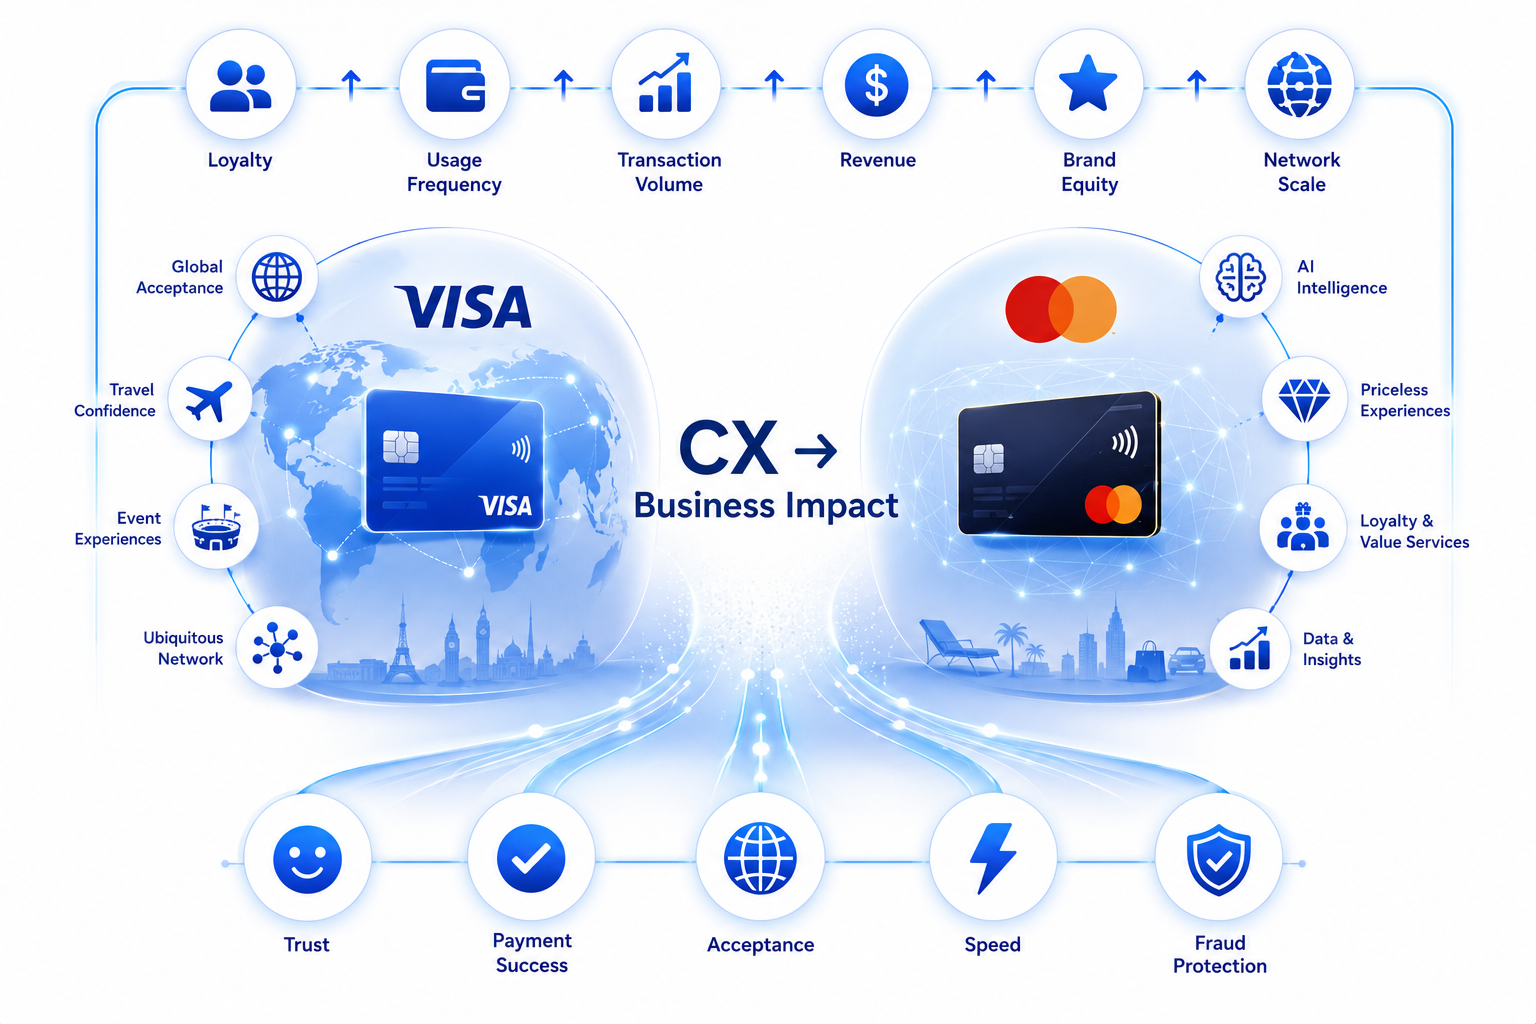
Visa and Mastercard do not compete the way most consumer brands compete. Their products are invisible by design. When payments work which they do, the overwhelming majority of the time, neither brand is noticed. The customer finishes their coffee, boards their flight, buys a jersey at the stadium, and moves on. No brand moment. No loyalty earned. Just infrastructure.
That invisibility is the product. It is also a vulnerability.
When payments fail at a World Cup venue, at an Olympic ticketing window, during a cross-border hotel check-in, the brand becomes visible in the worst possible way. The cardholder does not blame the issuing bank. They do not blame the acquirer. They do not blame the point-of-sale terminal manufacturer. They say 'my Visa didn't work' or 'my Mastercard was declined.' All the complexity of the four-party network collapses into four words. And those four words, repeated across 104 matches in 16 cities, or across 32 Olympic sports venues in Paris, are not just a customer service problem. They are a transaction volume problem, an issuer loyalty problem, a merchant retention problem, and a sponsorship ROI problem simultaneously.
This report maps what is publicly verifiable about how Visa and Mastercard manage CX at scale, applies NUMR's analytical framework to quantify the business impact of that CX management, and draws lessons for CX leaders in financial services and adjacent industries where the same dynamic invisible-by-design infrastructure that becomes visible only at failure applies in full.
Assessment based on publicly verifiable transaction data, network scale, sponsorship rights, and documented outage/fraud events. NPS and CSAT are not publicly disclosed by either network. NUMR treats any specific NPS claim for either brand with analytical caution.
1. The Unusual CX Model: Why Payment Networks Are a Different Animal
Before the Visa vs. Mastercard comparison can be useful to CX leaders, the category needs to be understood correctly. These are not consumer brands in the conventional sense. They are network orchestrators whose CX is experienced at a third remove through the bank that issued the card, the merchant that configured the terminal, the acquirer that processed the transaction, the wallet that tokenized the credential, and the event organiser that chose which cards to accept at the gate.
This creates what NUMR terms the Attribution Collapse problem: the experience is distributed across a four-party network, but the attribution is binary. It worked or it did not. And the attribution goes to the brand on the card.
Network Participant
Their Role in the CX
Who the Consumer Blames When It Fails
Issuing Bank
Approves or declines the transaction based on available funds, fraud signals, and account status
The card brand (Visa / Mastercard)
Acquiring Bank / Processor
Routes the transaction and maintains terminal uptime
The card brand
Merchant
Configures the terminal, sets accepted card types, manages queue flow
The card brand or the venue
Payment Network (Visa / Mastercard)
Sets the rails, authorization standards, and settlement rules
The card brand rightly so here
Wallet / Tokenization Layer
Apple Pay, Google Pay, and contactless provisioning/authentication services
The card brand or "my phone"
Event Organizer
Determines accepted payment methods, terminal density, and staff readiness
The card brand
This attribution collapse is not a perception problem to be managed with communications. It is a structural CX reality that demands a different measurement approach than traditional consumer brand CX.
In NUMR's framework, the payment network sits at the centre of a CX ecosystem where it both controls and does not control the outcome. It sets the rails, but it does not drive the trains. Its CX mandate is therefore twofold: first, make the rails so reliable that train failures are exceptional; second, build measurement and response systems that are fast enough to catch failures before the consumer's experience is permanently damaged.
"For payment networks, CX excellence is not about memorable moments. It is about zero unintended memorable moments. The experience should be frictionless to the point of invisibility. Every time a consumer notices their payment, it is either an earned marketing moment or a failure." NUMR CX Framework: Payment Infrastructure Category
2. The CX Metric Landscape: What Is Measurable, What Is Inferred, and What Is Hidden
Neither Visa nor Mastercard publicly discloses consumer-level NPS, CSAT, CES, false-decline rates by geography, or event-specific authorization failure rates. This is a deliberate strategic choice, one that NUMR believes carries its own cost, which we address in Section 7. For now, what is publicly verifiable forms the evidence base.
Authenticated Metrics
Metric
Visa (Verified)
Mastercard (Verified)
CX Implication
Annual Transaction Volume
257.5B transactions, $14.2T value (FY2025)
~160B transactions annually
Scale is a trust proxy and a resilience test. Each additional billion transactions is a billion moments of potential friction.
Revenue Growth
Q4 FY2024: +12% YoY, payments volume +8%
FY2024 revenue: $28.17B, operating income $15.58B
Growth sustained by consumer confidence in the network which is itself a CX output.
Cross-Border Volume
Q4 FY2025: cross-border +12%
Q4 2025: switched volume +9%
Cross-border is the highest-friction CX environment. Growth here signals reliability in the hardest conditions.
Fraud Prevention Scale
Disrupted $350M+ in attempted fraud in 2024
Decision Intelligence scores in under 50ms across ~160B transactions
Fraud prevention is both a safety metric and a CX metric false positives from aggressive models directly cause declined legitimate transactions.
Event Sponsorship Rights
FIFA 2026 Official Partner; Olympic sponsor 1986–2032; only card at Olympic venues
Not current FIFA or Olympic payment sponsor
Sponsorship creates a closed CX environment Visa controls the event payment experience; Mastercard competes for surrounding commerce.
Global decline incident, March 2025 (quickly resolved)
Legal and operational incidents are both CX events; they shape merchant behaviour and consumer confidence asymmetrically.
CX Proxies The Inferred Layer
Because direct metrics are not public, NUMR applies proxy analysis inferring CX quality from observable business outcomes, documented incidents, sponsorship architecture, and network design choices.
CX Proxy
What It Signals
Visa Reading
Mastercard Reading
Cross-border volume growth
Performance under the highest-friction CX conditions (foreign card, unfamiliar merchant, currency conversion)
Strong +12% Q4 FY2025
Solid +9% switched volume
Outage documentation
Network resilience; brand accountability when things go wrong
No major public outage documented in 2025 review period
March 2025 global decline incident resolved quickly, but visible
Authorization AI investment
Capability to reduce false declines the most common CX failure mode
Travel-aware authorization; FIFA/Olympic pre-coordination possible
Decision Intelligence <50ms; strongest public AI authorization narrative
Merchant relationship health
Merchant NPS is a downstream consumer CX signal steering and surcharging harm cardholders
Under DOJ scrutiny for debit routing merchant resentment risk
Similar fee structure; competing for merchant preference on value-add
Sponsorship investment
Brand salience at emotional peak moments the highest-stakes CX testing ground
FIFA + Olympics: controlled event CX environment
Other sports/events: ambient event presence without exclusivity
3. Normal-Times CX: The Baseline That Builds (or Erodes) Trust Invisibly
Between mega-events and documented incidents, both Visa and Mastercard are operating what amounts to the world's largest continuous CX programme. 257.5 billion Visa transactions per year is approximately 8,157 transactions per second, every second, across every time zone, every currency, every merchant category, and every consumer emotional state from routine grocery shopping to once-in-a-lifetime purchases.
CX at this scale cannot be managed the way a retailer manages store experience. But it can be measured, modelled, and improved in the same structural ways and the consequences of not doing so are the same: lower loyalty, higher churn, reduced advocacy, and weakened competitive position.
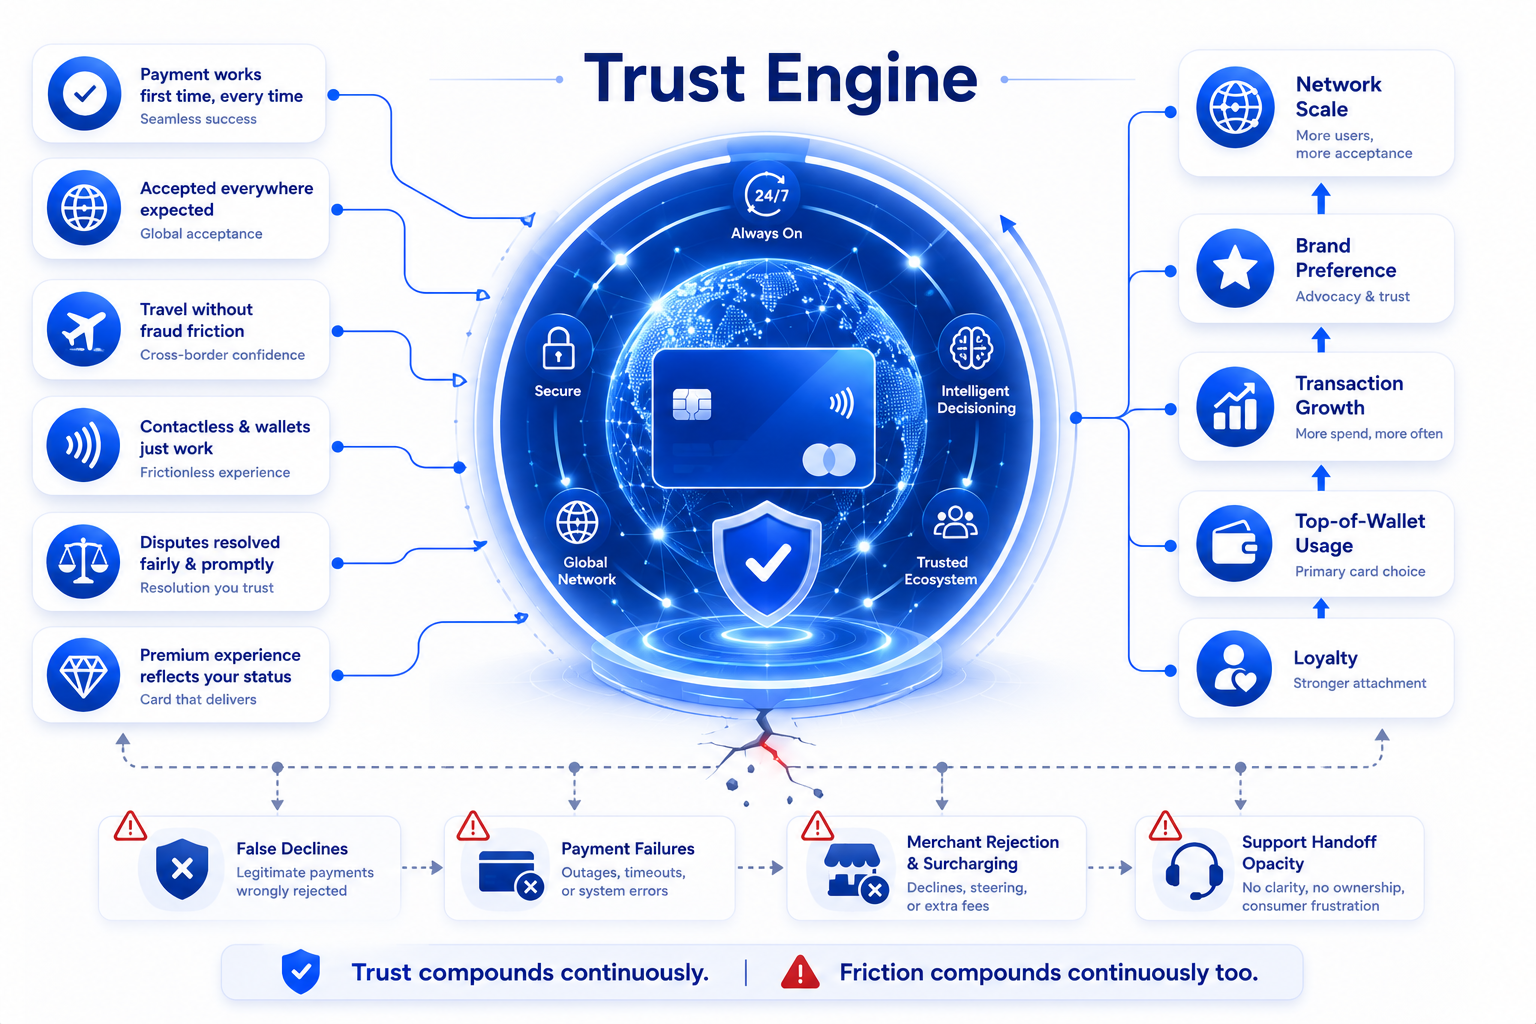
The Promoter Architecture: What Generates Advocacy for Each Network
Shared Promoter Drivers Both Networks
The payment works on the first attempt, every time, in every context
The card is accepted everywhere the cardholder expects it to be
International transactions clear without triggering fraud alerts on legitimate purchases
Mobile wallet and contactless integrations work without configuration friction
Disputes, when they occur, resolve fairly and within a timeline the cardholder considers reasonable
The card does not embarrass the holder at checkout in a social or business setting
Visa-Specific Promoter Drivers
The psychological assurance of 'default global card' status Visa is what most consumers reach for when they are uncertain about acceptance
FIFA and Olympic association for event-attending consumers, Visa's sponsorship creates pre-travel confidence that the card will work in the venue
Strong co-brand and issuer partnership depth premium travel cards, airline cards, and hotel cards bearing Visa's mark reinforce cross-border reliability
Market-leading transaction volume is itself a promoter signal ubiquity creates trust
Mastercard-Specific Promoter Drivers
The AI and intelligence narrative Decision Intelligence scoring in under 50 milliseconds is a genuine capability advantage that, when it prevents a fraudulent transaction, creates a promoter moment
'Priceless' experiential positioning Mastercard's brand architecture around irreplaceable experiences is one of the most coherent premium positioning plays in financial services
Value-added services for issuers and merchants analytics, identity, loyalty, and fraud tools that make Mastercard a preferred partner at the infrastructure layer, which flows through to card promotion at the consumer level
Strong premium-card presence World, World Elite, and similar tiers carry higher-income consumer profiles with higher transaction frequency and lower price sensitivity
The Detractor Architecture: Where Both Networks Create Silent Churn
The most damaging detractor dynamics for payment networks are not dramatic. They are silent. A cardholder whose Visa was declined while travelling does not usually file a formal complaint. They add a different card to their wallet and move Visa to a lower position in the stack. That is it. The revenue leaks from top-of-wallet demotion, not from customer defection.
Shared Detractor Drivers
False declines: legitimate transactions rejected by fraud models calibrated too conservatively the single highest-frequency CX failure mode in payment networks
Chargeback friction: dispute processes that feel adversarial, slow, or opaque especially when the consumer cannot understand which party (issuer, merchant, or network) is responsible for the resolution
Premium card rejection: a cardholder with a World Elite Mastercard or a Visa Infinite card discovering their tier is not accepted at a specific merchant creates a status violation that the network does not even know occurred
Merchant surcharging and steering: the proposed Visa/Mastercard merchant settlement could allow merchants to reject specific premium reward cards or surcharge by network if approved, this creates a new CX fracture where the consumer blames the network for a merchant's commercial decision
Support handoff opacity: when a payment fails, the consumer calls their bank, the bank says it is the network, the network says it is the issuer the circularity generates detractors faster than the original failure
Visa-Specific Detractor Risk
DOJ debit monopolization suit (2024): alleged 60%+ U.S. debit market share and $7B+ in annual fees creates a merchant hostility layer that can translate into routing changes, surcharging, or active steering away from Visa which the consumer experiences as checkout friction
Exclusivity accountability: at Olympic venues where Visa is the only accepted card, any payment failure is a brand failure with no fallback exclusivity amplifies both the benefit and the risk
Mastercard-Specific Detractor Risk
The March 2025 global decline incident: even a brief, quickly-resolved outage becomes disproportionately visible in payment infrastructure because the trust contract is binary. Mastercard's response management is as much a CX event as the incident itself
Lower mega-event salience: not being the FIFA or Olympic payment partner means Mastercard does not control the event payment environment which limits its ability to build promoter moments at the highest-stakes consumer touchpoints
4. Mega-Event CX: FIFA World Cup 2026 and the Olympics as Stress Tests
Mega-events are not just marketing opportunities for payment networks. They are diagnostic stress tests of the conditions under which every structural weakness in the authorization, fraud detection, terminal management, cross-border routing, and consumer communication architecture gets simultaneously amplified.
FIFA World Cup 2026 runs across 104 matches in 16 cities in three countries (USA, Canada, Mexico) over roughly a month. The Paris 2024 Olympics ran 32 sports across multiple venues over 16 days. In both cases, the payment environment looks like this: high transaction volume spikes concentrated in short windows, unusually high proportion of cross-border cardholders using unfamiliar merchants, heightened fraud attempt rates targeting event consumers, mobile congestion affecting contactless terminal performance, emotionally high-stakes purchases (tickets, hospitality, travel) where failure is disproportionately damaging, and multilingual consumer populations who cannot navigate complex issuer support flows.
Visa at FIFA World Cup 2026 and the Olympics: The Controlled Environment Advantage
Visa's position at both events is structurally distinct from any other payment brand in the world. It is not simply a sponsor. At the Olympics, it is the only payment card accepted at Olympic and Paralympic venues, a partnership that has run continuously since 1986 and extends through 2032. At FIFA World Cup 2026, Visa is listed among official FIFA global partners, with the partnership explicitly extended to include the 2026 tournament.
What this means for CX is not obvious at first glance. Official exclusivity sounds like a marketing claim. It is actually an operational architecture. Visa can coordinate with venue operators, acquirers, ticketing platforms, and hospitality providers in ways that no other network can because no other network has the same seat at the planning table.
Visa Event CX Capability (From Exclusivity)
Business Impact
CX Failure Mode Without This Capability
Pre-event terminal certification with venue acquirers
Reduces scan failure rate, reduces queue time, reduces entry friction
Uncertified terminals create authorization failures at the gate highest-visibility failure possible
Issuer travel-readiness coordination
Pre-whitelisted venue/acquirer patterns reduce false declines for international cardholders
International fans declined on arrival because issuer fraud model unfamiliar with the venue
Event-surge authorization playbooks
Stress-tested authorization flows handle volume spikes without latency degradation
Slow authorization at peak moments creates queues and perceived network failure
Brand salience = top-of-wallet priming
International fans arriving for the World Cup or Olympics are primed to carry and use their Visa card
Without salience, consumers arrive with multiple cards and use whichever works first potentially not Visa
Post-event advocacy capture opportunity
Visa's visibility throughout the event journey enables direct CX measurement and loyalty conversion
Without visibility, the CX moment passes unexploited no data, no conversion, no advocacy captured
NUMR INSIGHT: Visa's Olympic and FIFA exclusivity is one of the most valuable CX architecture advantages in global commerce but only if it is operationalized as a measurement and improvement system, not just a branding exercise. Exclusivity without measurement is a risk amplifier: you own the outcome but have no early warning when it is going wrong.
Mastercard at FIFA 2026 and the Olympics: The Perimeter Commerce Strategy
Mastercard does not hold the FIFA or Olympic payment sponsorship. This is not a minor competitive disadvantage. It means Mastercard cannot control the event payment environment, cannot guarantee its cards are the ones promoted at venue entry, and cannot coordinate pre-event with venue acquirers in the same way Visa can.
But the event commerce map extends well beyond the venue perimeter. And Mastercard's opportunity is the full geography of the event city, not just the stadium.
Hotel bookings for 5+ nights across 16 host cities for international fans
Airline and high-speed rail transactions for cross-country travel within the USA, Canada, and Mexico
Restaurant, bar, and nightlife spend the highest-volume per-city commerce category during the event period
Rideshare, transit, and airport transfers high-frequency, high-cross-border proportion
Retail, merchandise, and souvenir purchasing off-venue
International e-commerce for remote fans purchasing event-related products
This is an enormous commercial surface. The question is whether Mastercard has the CX measurement architecture to know if it is winning or losing that surface in real time and to intervene when it is not.
"Visa owns the stadium. Mastercard has the rest of the city. The question is which brand knows what is happening on its territory at match time and which one finds out three months later in a quarterly report." NUMR CX Strategy Analysis
The Mega-Event Failure Taxonomy
NUMR's analysis of payment CX failure at mega-events identifies ten recurring failure modes, ordered by consumer emotional impact. These are not hypotheticals; they are patterns drawn from documented incidents at previous major events and from the structural characteristics of cross-border, high-volume, high-stakes payment environments.
Failure Mode
Consumer Emotional Impact
Business Consequence
Measurement Required
Card declined at venue entry with sufficient funds
Extreme combines public embarrassment with event access denial
Immediate NPS crater; social amplification; incident reporting
Real-time false-decline rate by venue gate
Foreign card blocked as fraud during first event purchase
High creates fear of using card for remainder of event
Top-of-wallet demotion for the entire event duration
Cross-border false-positive rate; travel notification system uptake
Mobile wallet or contactless rejected at point of sale
High especially for younger, digitally-native consumers who do not carry physical cards as backup
Digital credential trust damage; app store review impact
Contactless/wallet acceptance rate by terminal
Long queues at payment terminal due to authorization latency
Medium-high degrades the overall event experience even if payment eventually succeeds
Negative association between brand and venue quality
Authorization latency percentile tracking by city
Dynamic currency conversion applied without clear consumer consent
Medium primarily affects international cardholders; creates confusion and perceived fraud
Dispute volume increase; issuer support cost
DCC incidence rate; dispute initiation rate
Duplicate charge after terminal error
High creates panic during a high-emotion event day
No multilingual issuer support available in host city languages
Medium particularly for non-English-speaking international fans who cannot navigate support
Unresolved issues become post-event detractors
Multilingual support availability; resolution rate by consumer language
5. The CX-to-Revenue Chain: How Payment Friction Translates to Business Impact
Payment friction is not a customer satisfaction problem that sits alongside the P&L. It is a mechanism that operates directly on revenue, margin, and competitive position across five distinct CLTV layers. NUMR's framework maps each layer with its driver metrics and business consequences.
The Five-Layer CLTV Model for Payment Networks
Failure Mode
Consumer Emotional Impact
Business Consequence
Measurement Required
Card declined at venue entry with sufficient funds
Extreme combines public embarrassment with event access denial
Immediate NPS crater; social amplification; incident reporting
Real-time false-decline rate by venue gate
Foreign card blocked as fraud during first event purchase
High creates fear of using card for remainder of event
Top-of-wallet demotion for the entire event duration
Cross-border false-positive rate; travel notification system uptake
Mobile wallet or contactless rejected at point of sale
High especially for younger, digitally-native consumers who do not carry physical cards as backup
Digital credential trust damage; app store review impact
Contactless/wallet acceptance rate by terminal
Long queues at payment terminal due to authorization latency
Medium-high degrades the overall event experience even if payment eventually succeeds
Negative association between brand and venue quality
Authorization latency percentile tracking by city
Dynamic currency conversion applied without clear consumer consent
Medium primarily affects international cardholders; creates confusion and perceived fraud
Dispute volume increase; issuer support cost
DCC incidence rate; dispute initiation rate
Duplicate charge after terminal error
High creates panic during a high-emotion event day
No multilingual issuer support available in host city languages
Medium particularly for non-English-speaking international fans who cannot navigate support
Unresolved issues become post-event detractors
Multilingual support availability; resolution rate by consumer language
The Friction-to-Revenue Formula
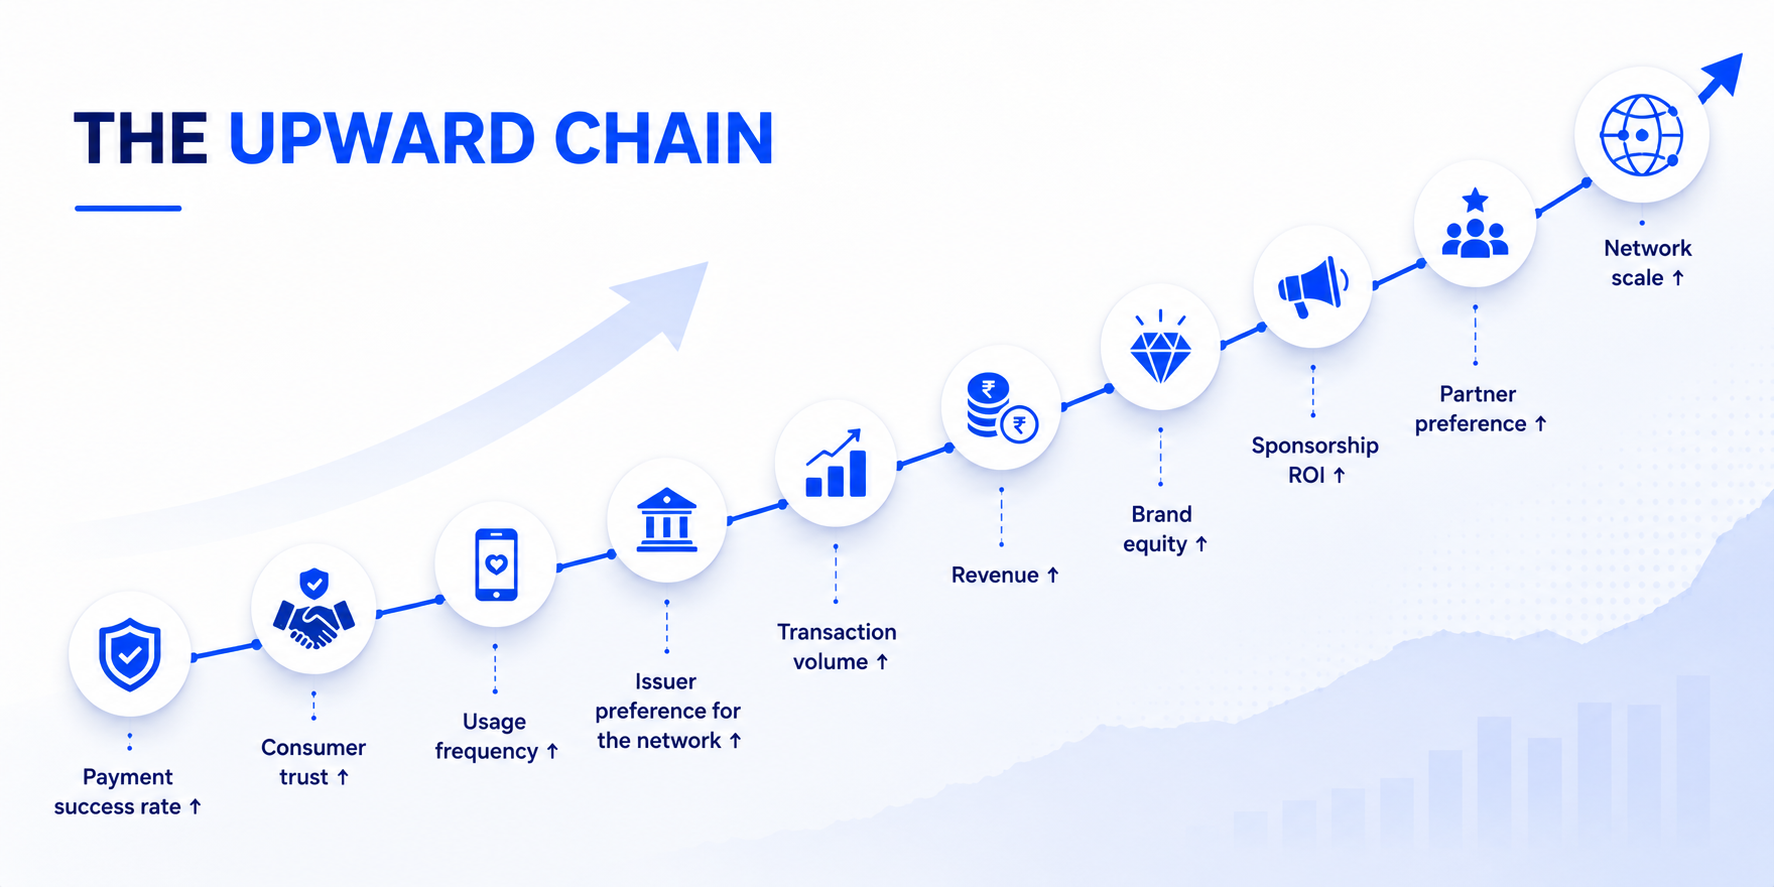
NUMR models the CX-to-revenue chain as a sequential multiplier system. Each improvement in a CX metric at one stage of the chain amplifies business outcomes at the next.
THE UPWARD CHAIN: Payment success rate ↑ → Consumer trust ↑ → Usage frequency ↑ → Issuer preference for the network ↑ → Transaction volume ↑ → Revenue ↑ → Brand equity ↑ → Sponsorship ROI ↑ → Partner preference ↑ → Network scale ↑
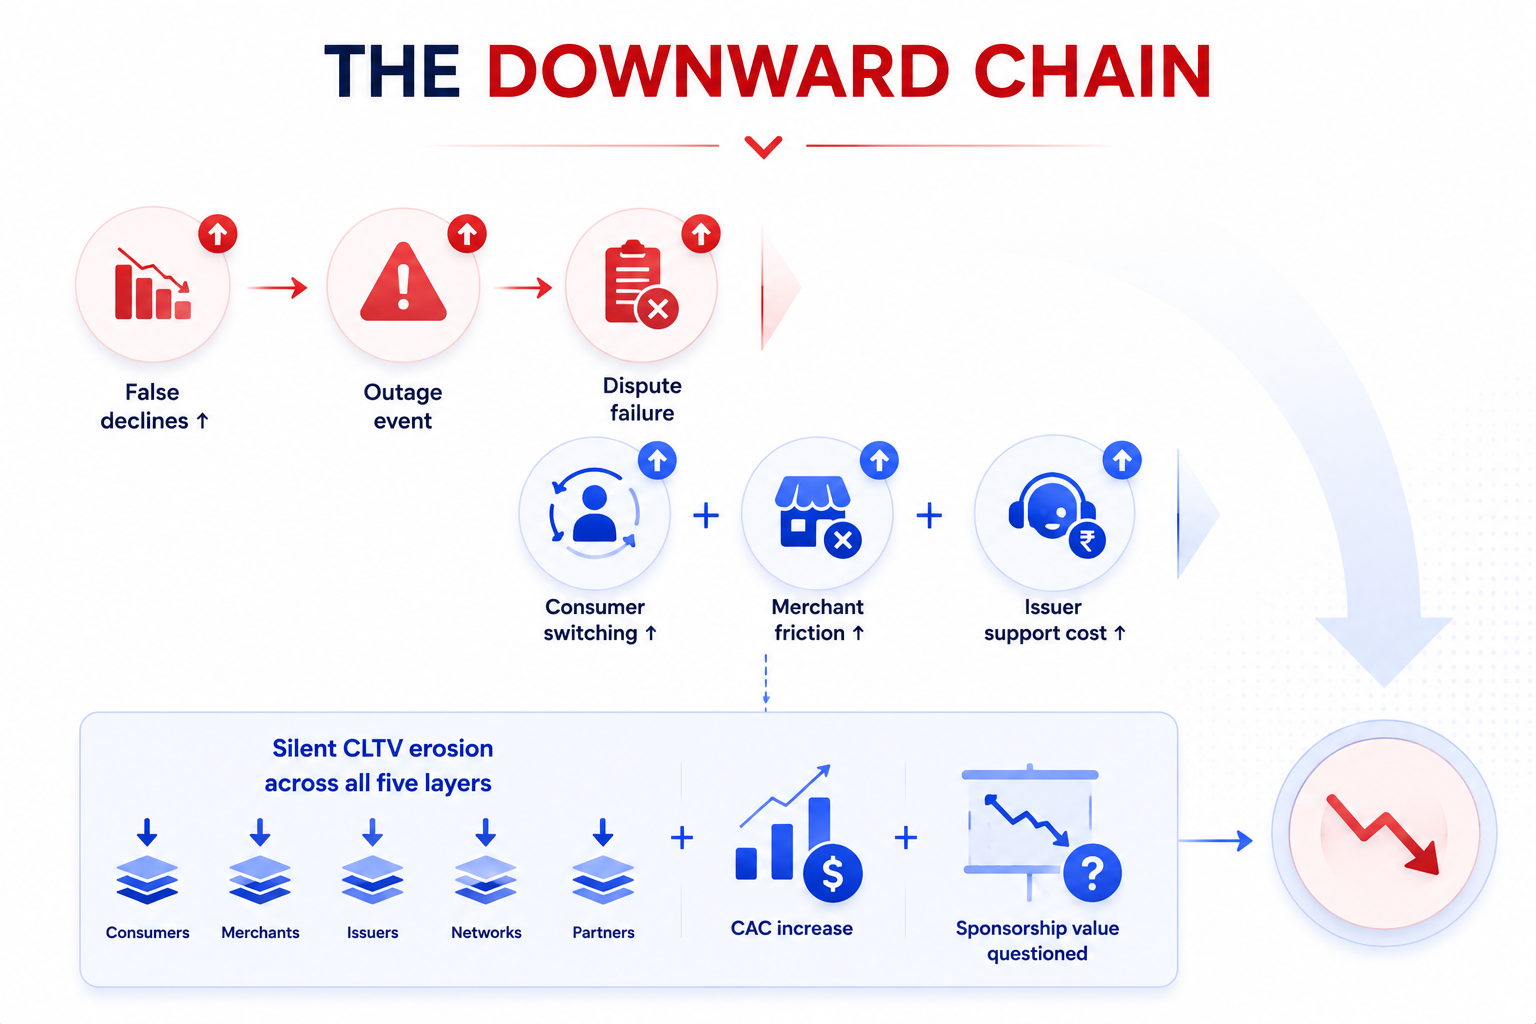
THE DOWNWARD CHAIN: False declines ↑ / Outage event / Dispute failure → Consumer switching ↑ + Merchant friction ↑ + Issuer support cost ↑ → Silent CLTV erosion across all five layers + CAC increase + Sponsorship value questioned
What makes this chain particularly important for financial services CX leaders is the asymmetry between the upward and downward dynamics. Trust accumulates slowly through thousands of frictionless transactions over months. It can be damaged in a single high-stakes moment. A payment failure at a World Cup venue is not equivalent to a payment failure at a grocery store. The emotional multiplier at high-stakes moments is estimated at 5–7 times the standard baseline meaning a failure that would create a mild detractor in normal commerce creates a severe detractor at an event.
How Friction Raises CAC
CAC elevation from CX failure is less visible than CLTV reduction but equally costly. The mechanisms are direct:
more rewards spend required to rebuild top-of-wallet position after a failure eventConsumer recovery:
networks must offer richer incentive structures to issuers when cardholder preference is weakeningIssuer incentive inflation:
poor dispute experience and fee resentment require more marketing support and tooling investment to maintain acceptance and promotionMerchant concession escalation:
if the World Cup or Olympics payment experience is not demonstrably better than competitors, the sponsorship ROI becomes harder to defend at renewal and the renewal cost increasesSponsorship justification burden:
NUMR's position: the lowest-CAC payment network in a five-year horizon is not the one with the lowest fee structure. It is the one with the highest CX reliability, because reliability compounded over time produces organic issuer promotion, merchant preference, and consumer advocacy none of which appear on the CAC line but all of which reduce it.
6. The NUMR Measurement Architecture: What Both Networks Should Be Tracking
The absence of publicly disclosed CX metrics from Visa and Mastercard is not a data problem. Both organisations have access to granular transaction data that most CX programmes would consider extraordinary. The gap is in measurement architecture specifically, in the translation of operational transaction data into CX decision metrics that connect to business outcomes.
NUMR's measurement framework for a payment network at scale would operate across four layers simultaneously.
Layer 1: Consumer Experience Metrics
Metric
Definition
Measurement Point
Business Outcome Linked
False Decline Rate
Percentage of approved authorizations that were blocked by fraud models despite being legitimate
Real-time, by geography, merchant category, and card tier
Top-of-wallet demotion rate; silent churn signal
Authorization Latency Percentile
p95 and p99 authorization response time, not just mean because it is the slowest transactions that create queue experience
By venue, city, and peak vs. off-peak window
Queue time, terminal throughput, consumer experience at high-stakes moments
Cross-Border Approval Rate
Approval rate for transactions where the issuing country differs from the merchant country
By country pair, card tier, and merchant category
International consumer confidence; travel card preference
Consumer-Facing Dispute Resolution Time
Days from dispute initiation to resolution, as experienced by the cardholder not internal cycle time
By dispute reason code, channel, and resolution outcome
Post-event detractor rate; issuer support cost
Contactless and Wallet Acceptance Rate
Percentage of contactless or wallet-presented transactions that complete without fallback to chip or swipe
Ratio of dispute initiations to total transactions normalized by category to allow cross-event comparison
By merchant category and event type
Merchant confidence; network health signal
Layer 2: Operational KPIs (Event-Specific)
KPI
Why It Is a CX Metric, Not Just an Ops Metric
Terminal uptime percentage by venue gate
A terminal that is down for 3 minutes at match entry generates a queue that affects hundreds of consumers simultaneously a single point of failure with multiplied CX impact
Scan failure rate at venue entry
The highest-visibility payment failure moment in the event journey; directly correlates with post-event complaint volume
Authorization success rate during first 15 minutes post-venue-entry
The surge period when volume is highest and failure is most socially visible
Fraud alert trigger rate for event-location merchants
High fraud alert rates at verified event venues signal that the fraud model has not been tuned for event conditions a calibration failure with CX consequences
DCC opt-out rate by nationality
High opt-out rates signal that DCC was presented in a way that felt coercive or confusing a consent design failure
Multilingual support resolution rate
Unresolved support issues in non-English languages are invisible to most analytics teams but disproportionately damaging to international consumer advocacy
Layer 3: Commercial Intelligence Metrics
Metric
What It Reveals
Post-event top-of-wallet shift
Did consumers who used Visa or Mastercard at the World Cup / Olympics increase or decrease usage of that card in the 90 days post-event? This is the sponsorship ROI metric that neither brand publicly tracks.
Issuer promotion rate shift by market
Did issuing banks in the top 10 tourist-origin markets increase promotion of the network's cards post-event? This is the downstream commercial signal of consumer CX quality.
Merchant acceptance rate change at event cities post-tournament
Did merchants in host cities adopt higher contactless penetration or new terminal infrastructure during the event period? Does it persist? Persistent adoption is a merchant CX legacy.
Cross-border transaction frequency change for event-attending consumers
Consumers who successfully transact internationally at a mega-event are significantly more likely to use the same card for subsequent international travel. Measuring this frequency shift quantifies the event's long-term commercial value.
Co-brand acquisition conversion from event campaigns
What proportion of event-attending consumers who were exposed to Visa/Mastercard event branding converted to a co-brand card product within 90 days?
Layer 4: Strategic CX Intelligence
This is the layer that transforms transaction analytics into organisational learning and the layer where NUMR's analytical framework operates most distinctively.
Which specific CX variables (false decline rate, authorization latency, dispute time, DCC incidence) explain the most variance in post-event consumer satisfaction and subsequent usage frequency? Without this, CX investment goes to the most visible improvement, not the highest-leverage one.Driver Analysis:
For event-context consumers, pre-purchase expectations are measurably higher than for everyday commerce consumers. Measuring the gap between stated expectation and delivered experience by event type and card tier reveals which products are over-promising relative to operational capability.Expectation-Delivery Gap Modelling:
Social listening across 16 host cities during World Cup 2026 parsed by language, merchant category, and payment complaint theme provides a real-time CX signal that is faster than survey data and more granular than authorization data.Sentiment and VOC Analysis:
Comparing the 90-day and 12-month transaction trajectories of consumers who had a payment failure event vs. consumers who did not control prior usage patterns provides the first direct estimate of CLTV erosion from a CX failure. This number, consistently and accurately measured, is the business case for every CX investment the network makes.CLTV Cohort Analysis:
7. Strategic Recommendations: Visa
Visa's strategic CX opportunity is to convert its FIFA and Olympic exclusivity from a brand investment into a measurable, repeatable CX system that demonstrably changes consumer behaviour, issuer preference, and merchant advocacy and can be proven to do so.
Visa is the only accepted card at Olympic venues. That exclusivity should come with public accountability. Publishing terminal uptime, authorization success rate, and contactless penetration metrics for major event venues even in aggregate, without revealing commercially sensitive infrastructure would establish Visa as the global benchmark for event payment CX. The absence of such disclosure currently means the exclusivity is an input, not a proof.
Business case: Published performance metrics become the most credible enterprise sales tool in Visa's institutional portfolio. CFOs at global banks choosing between network co-brand partnerships do not want a hospitality presentation. They want performance data.
Before the FIFA World Cup 2026 and before every subsequent major event, Visa should deploy: a 'Will my card work at this venue?' check integrated into issuer apps and the Visa website; travel-token provisioning prompts for international fans before departure; issuer coordination playbooks for false-decline reduction in the 30 days pre-event; and wallet provisioning guides in the top five fan-origin market languages.
Business case: Pre-arrival consumer confidence is the highest-leverage CX investment in event commerce. Consumers who are confident their card will work arrive with Visa as their first choice. Consumers who are uncertain arrive with three cards and use whichever works. Confidence is not built at the venue. It was built before the trip.
For every consumer who uses a Visa card at an Olympic or FIFA event, track the 90-day and 12-month transaction trajectory and compare it to a matched cohort of non-event consumers. The delta between those trajectories is the measurable CLTV impact of the sponsorship investment, a number that currently does not exist publicly, and may not exist internally with sufficient rigour.
Business case: Without this metric, Visa's sponsorship ROI is a marketing debate. With it, it is a balance sheet argument. The difference matters at board level.
Recommendation 4: Turn Exclusivity into Service Recovery Insurance
The risk of being the only card at Olympic venues is that any failure is amplified. Visa needs a real-time service recovery infrastructure at each Olympic and FIFA event: on-site payment support staff with authority to resolve issues immediately, emergency card provisioning for international fans whose primary card fails, and a dedicated dispute-fast-track for event-related transactions that commits to resolution within 48 hours.
Business case: A consumer whose failed Visa payment was resolved within 48 hours with no effort required produces a post-event NPS score comparable to a consumer who had no failure. Without service recovery infrastructure, failures become permanent detractors.
8. Strategic Recommendations: Mastercard
Mastercard's strategic CX opportunity is to convert its AI and intelligence advantages into consumer-visible benefits and to own the event commerce perimeter so thoroughly that consumers who used Mastercard for every event-adjacent purchase remember it as the network that made the experience work, even if Visa was the card inside the stadium.
Recommendation 1: Make AI Authorization Consumer-Visible
Decision Intelligence scoring in under 50 milliseconds is a genuine competitive capability. The problem is that consumers do not experience it as a feature; they experience the absence of false declines, which they attribute to nothing in particular. Mastercard should close this attribution gap: communicate proactively when a transaction that might have been declined elsewhere was approved; explain in issuer communications what Decision Intelligence does in human terms; and track the false-decline rate publicly as a benchmark commitment.
Business case: Consumers who know why their card works are more loyal to it than consumers who simply experience it working. Attributed benefit generates advocacy. Unattributed benefit does not.
Recommendation 2: Own the Event Perimeter Commerce Map
For FIFA World Cup 2026, Mastercard should deploy a city-by-city event commerce strategy: partner with the top five hotel chains in each host city for Mastercard-exclusive benefits; activate premium transit payment acceptance across all 16 host cities' metro, ride-share, and airport systems; and create a World Cup city guide for Mastercard cardholders that maps accepted merchants, dining recommendations with Mastercard benefits, and real-time payment support contacts.
Business case: Mastercard cannot control who is accepted inside the stadium. It can absolutely control whether its cardholders have a demonstrably better commerce experience in the 10 square miles around it.
Recommendation 3: Create a Premium Travel Assurance Product
For World Elite and similar premium tiers, Mastercard should create an event-commerce specific benefit package: proactive payment readiness notification before international travel; multilingual support in all 16 host city languages; emergency card replacement within 24 hours in any host city; and a dispute priority fast-track for event-related transactions. This is not a new product. It is a CX packaging of capabilities Mastercard's infrastructure already supports.
Business case: Premium card holders have higher income, higher transaction frequency, and higher advocacy multiplier. Investing in their event CX has a return that is disproportionate to the cost.
Recommendation 4: Measure and Publish CX Proxy Metrics
Mastercard should lead the industry in CX transparency by publishing false-decline rate improvement trajectories, authorization speed benchmarks, dispute resolution time reductions, and fraud-loss prevention as consumer-facing metrics not just institutional data points. The March 2025 incident created a trust deficit that can only be addressed by demonstrating reliability, not asserting it.
Business case: In B2B markets (issuers, merchants, platforms, events), data-backed performance claims convert at higher rates than brand claims. 'Our false-decline rate is down 22% year-on-year' is a stronger sales tool than 'Mastercard: Doing Well by Doing Good.'
9. What the Visa vs. Mastercard Dynamic Teaches Every CX Leader
The Visa-Mastercard comparison is not primarily interesting as a competitive analysis. It is interesting as a case study in what happens when CX operates at the intersection of invisible infrastructure, high-stakes moments, and distributed accountability. Those conditions exist in a surprising number of industries beyond payments.
Visa / Mastercard Pattern
The Equivalent in Your Industry
The NUMR Lesson
Attribution collapse: blame lands on the brand regardless of where the failure occurred
Call centre CX blamed on the bank. Patient experience blamed on the hospital. Airline experience blamed on the carrier.
Own the attribution even when you do not own the failure. Measurement and response infrastructure separates 'we got blamed' from 'we fixed it.'
Silent churn: wallet demotion without cancellation
Customers who reduce order frequency, reduce engagement, or stop opening emails without formally churning
Silent churn is invisible without cohort CLTV tracking. If your CX measurement only counts cancellations, you are measuring the last 5% of the problem.
Exclusivity accountability: being the only option amplifies risk as much as benefit
Sole supplier relationships, exclusive platform access, regulatory monopolies
Exclusivity without measurement is a risk amplifier. You need better CX monitoring precisely because customers have no alternative.
Mega-event as stress test: normal systems fail under emotional and volume amplification
Quarter-end spikes, major launches, policy change communications, claim surges
Stress events are diagnostic gifts. The systems that fail under load show you exactly where to invest in normal-times CX infrastructure.
The 5-layer CLTV model: consumer, issuer, merchant, event partner, fintech
Measuring only end-consumer NPS misses commercial value destruction happening upstream.
Extraordinary data access; no public CX metrics
Internal CX data available but not connected to business outcome measurement
Data availability is not measurement maturity. If your CX data cannot answer which metric change drove which revenue outcome, your measurement architecture is incomplete.
10. The NUMR CXM Platform: Connecting CX Metrics to the Business Outcomes That Matter
The central finding of this report is not that Visa is better than Mastercard or vice versa. It is that both organisations are operating without a publicly visible CX measurement architecture that connects their experience performance to their business outcomes. That gap is not unique to payment networks. It is the defining CX maturity challenge of every organisation operating complex, multi-party, high-volume customer environments which includes every financial services institution, every major retail chain, every automotive OEM, and every enterprise service provider that NUMR works with.
The organisations that close that gap that can trace a 3-point NPS improvement to a specific authorization friction reduction, and connect that reduction to a measurable CLTV uplift across a defined customer cohort are the ones that turn CX from a cost centre into a revenue strategy.
NUMR is built for that translation. Not just measurement for measurement's sake. Measurement that tells your leadership team which CX metric is moving which business lever and what to do about it before the quarterly review.
What CX Leaders in Financial Services and Retail See in NUMR's Dashboard
NUMR Capability
What It Answers in a Payments or Financial Services Context
Driver Analysis Widget
Which CX variables, false decline rate, authorization speed, dispute time, branch wait time explain the most variance in your NPS or CSAT? Not what you think is driving it. What the data says is driving it.
Multidimensional NPS
NPS by product tier, geography, event type, customer segment, and journey stage cross-tabulated, not averaged into a single number that tells you nothing actionable.
Silent Churn Detection via CLTV Cohort Tracking
Which customer cohorts are reducing transaction frequency or product usage without triggering a formal churn event? The demotion in the wallet stack that no CX team is currently measuring.
Real-Time Alert Module with Journey Context
Threshold-based alerts when authorization failure rates, complaint volumes, or satisfaction scores breach defined limits with journey-stage context, not just a data point.
VOC / Sentiment Widget with NLP Classification
What are your customers and cardholders actually saying about payment experiences in real time, across languages, classified by complaint theme and merchant category?
Event-Period Operational Dashboard
Real-time tracking of key CX metrics during high-volume stress events the equivalent of what both Visa and Mastercard should be running across 16 FIFA host cities simultaneously.
CX-to-Revenue Attribution Modelling
The direct answer to the question neither Visa nor Mastercard can publicly answer: what is the measurable revenue impact of a 1-point improvement in authorization success rate, or a 2-day reduction in dispute resolution time?
"The question is never whether CX matters. The question is whether your measurement architecture can prove it in numbers your CFO will act on." NUMR CX Philosophy
If your organisation has the data but not the architecture to connect it to business outcomes, if your dashboard shows you what happened but not what drove it or what to do next that is precisely the gap NUMR closes.
See NUMR CXM in Action
Book a demo and see how NUMR connects your CX metrics to revenue outcomes with driver analysis, CLTV cohort tracking, event-period operational dashboards, and VOC intelligence that tells your leadership team which levers to pull, not just which numbers to watch.Book a Demo with NUMR CXM
Scope, Methodology, and Data Notes
This study is based exclusively on publicly verifiable information available as of June 20, 2026. Sources include Visa's public company profile and FY2024–FY2025 results coverage, Mastercard's public financial disclosures and executive statements reported by Business Insider, FIFA's official 2026 World Cup hospitality and sponsorship pages, the IOC/Visa Olympic partnership documentation, AP News, The Guardian, WSJ, The Verge, The Sun / Fox Business-reported Mastercard incident coverage, and AP reporting on the proposed merchant settlement.
Visa and Mastercard do not publicly disclose consumer-facing NPS, CSAT, CES, false-decline rates by geography, event-specific authorization failure rates, or dispute resolution time benchmarks in a format that enables direct comparison. All CX quality analysis in this study is based on authenticated transaction metrics, proxy indicators, documented incidents, and NUMR's analytical framework. No specific NPS or CSAT figures are attributed to either brand.
Benchmark figures and multiplier estimates cited in this document (e.g., emotional multiplier at high-stakes events; CLTV erosion from CX failure events) are drawn from NUMR's internal CX benchmarking framework and should be verified against client-specific data before external citation or use in financial projections.
This report represents NUMR's independent analytical perspective and does not constitute a commercial relationship with, endorsement of, or advisory engagement with Visa, Mastercard, FIFA, or the IOC.
Frequently Asked Questions (FAQs)
Which survey channel has the highest response rate?
SMS surveys consistently generate some of the highest survey response rates across industries. Industry benchmark studies frequently report SMS response rates between 45% and 60% because survey invitations are delivered directly to customers' mobile devices and require minimal effort to complete.
However, the highest response-rate channel is not always the most effective channel. The best survey channel depends on customer context, journey stage, and the type of feedback being collected.
Are WhatsApp surveys better than email surveys?
In many mobile-first markets, WhatsApp surveys often outperform traditional email surveys in terms of participation. Customers already use WhatsApp as a primary communication channel, making survey requests feel more natural and convenient.
That said, email surveys remain valuable when organizations need longer responses, detailed customer feedback, relationship NPS measurement, or more complex survey structures. The right choice depends on the customer journey rather than channel benchmarks alone.
Why do in-app surveys usually achieve higher response rates?
In-app surveys reduce participation friction because feedback is collected while customers are actively using the product or service.
Customers do not need to switch channels, open an email, or remember a previous interaction. According to multiple customer experience studies, contextual feedback requests often generate significantly higher participation because the experience being measured is still fresh in the customer's mind.
Is email still useful for customer feedback surveys?
Yes. Although email surveys generally produce lower response rates than SMS or WhatsApp surveys, they continue to play an important role in Voice of Customer (VoC) programs.
Email is particularly effective for:
Relationship NPS surveys
Quarterly customer feedback programs
Customer advisory research
Product improvement studies
B2B customer experience measurement
Detailed open-ended feedback collection
Email often produces richer feedback even when participation rates are lower.
How do survey channels affect feedback quality?
Survey channels influence more than response rates. They also affect feedback quality, completion rates, representativeness, and customer effort.
For example:
SMS surveys typically generate fast responses and strong participation.
Email surveys often produce more detailed comments.
WhatsApp surveys create a conversational experience that can improve engagement.
The strongest CX programs evaluate both response quantity and response quality when selecting survey channels.
What survey channel works best for NPS surveys?
The best NPS survey channel depends on whether you are measuring a transaction or a relationship.
For transactional NPS surveys, organizations commonly use:
SMS
In-app surveys
WhatsApp
For relationship NPS surveys, organizations often prefer:
Email surveys
Customer panels
Structured VoC programs
The objective is to collect feedback at the moment when customers can provide the most accurate assessment of their experience.
Should organizations use multiple survey channels?
Yes. Most mature Voice of Customer programs use a multi-channel survey strategy rather than relying on a single channel.
Combining:
SMS surveys
WhatsApp surveys
In-app surveys
Email surveys
IVR surveys
Website feedback widgets
helps organizations reach different customer segments, reduce channel fatigue, and improve feedback representativeness.
Multi-channel listening often produces more reliable customer intelligence than any single-channel approach.
What is survey fatigue and how does it affect response rates?
Survey fatigue occurs when customers receive too many feedback requests over a short period of time.
As survey frequency increases, customers become less likely to participate and more likely to ignore invitations altogether. Research consistently shows that excessive surveying can reduce response rates, lower completion rates, and negatively affect feedback quality.
Organizations can reduce survey fatigue by:
Limiting survey frequency
Coordinating outreach across departments
Using journey-based survey triggers
Selecting the most appropriate channel for each interaction
How should BFSI organizations choose survey channels?
Banks, insurers, and financial institutions should align survey channels with specific customer journeys.
For example:
Customer Journey
Recommended Channel
Branch Visit
SMS
Mobile Banking Experience
In-App Survey
Contact Center Interaction
SMS or IVR
Loan Application Journey
Email or WhatsApp
Credit Card Service Experience
SMS
Relationship NPS Program
Email
The most effective BFSI feedback programs focus on customer accessibility and journey context rather than using a single channel for every interaction.
What is the biggest mistake organizations make when selecting survey channels?
The most common mistake is choosing channels solely based on response-rate benchmarks.
Many organizations see that SMS generates higher response rates than email and immediately shift all survey activity to SMS. However, channel effectiveness depends on:
Customer behavior
Journey stage
Feedback complexity
Communication preferences
Accessibility requirements
The best survey channel is rarely the one with the highest benchmark response rate. It is the channel that feels most natural to the customer at the moment feedback is requested.
How can organizations improve survey response rates across all channels?
Sending surveys closer to the customer interaction
Using mobile-friendly survey designs
Keeping surveys short and focused
Personalizing survey invitations
Matching channels to customer preferences
Avoiding excessive reminders
Reducing survey fatigue
Organizations that align survey delivery with customer journeys typically achieve higher participation and better-quality feedback.
Why is customer journey context more important than channel benchmarks?
A channel benchmark tells you how a survey channel performs on average. Customer journey context tells you whether the feedback request makes sense to the customer at that specific moment.
A well-timed survey delivered through the right channel often outperforms a benchmark-leading channel used in the wrong context. This is why modern CX programs increasingly focus on journey-based feedback collection rather than channel-based optimization alone.
Ultimately, the goal is not simply to maximize survey response rates. The goal is to collect representative, actionable customer feedback that improves business decisions.
Author Name
Gourab Majmuder
Author Bio:
Gourab is a passionate marketer expert with deep interests in CX, entrepreneurship, and enjoys growth hackingearly stage global startups.
Subscribe to our newsletter
Thank you! Your submission has been received!
Oops! Something went wrong while submitting the form.


.png)
.png)
.png)