.png)
When organizations want to understand how people feel, not just what they do, they need a structured way to measure attitudes.
That’s exactly where the Likert-style rating scale becomes useful.
Instead of asking simple yes/no questions, a Likert scale allows respondents to express levels of agreement, satisfaction, or perception. This makes it possible to measure complex experiences like:
Because responses are captured on a consistent scale, organizations can analyze patterns across large groups of respondents. In the sections ahead, we’ll explain what a Likert scale is, how Likert rating scales work in surveys, and how researchers analyze Likert data to uncover insights.
A Likert-style rating scale is a structured response format used in surveys to measure attitudes, opinions, or perceptions toward a statement. Instead of simple yes/no answers, respondents indicate their level of agreement across a graded scale.
The Likert scale definition is straightforward:
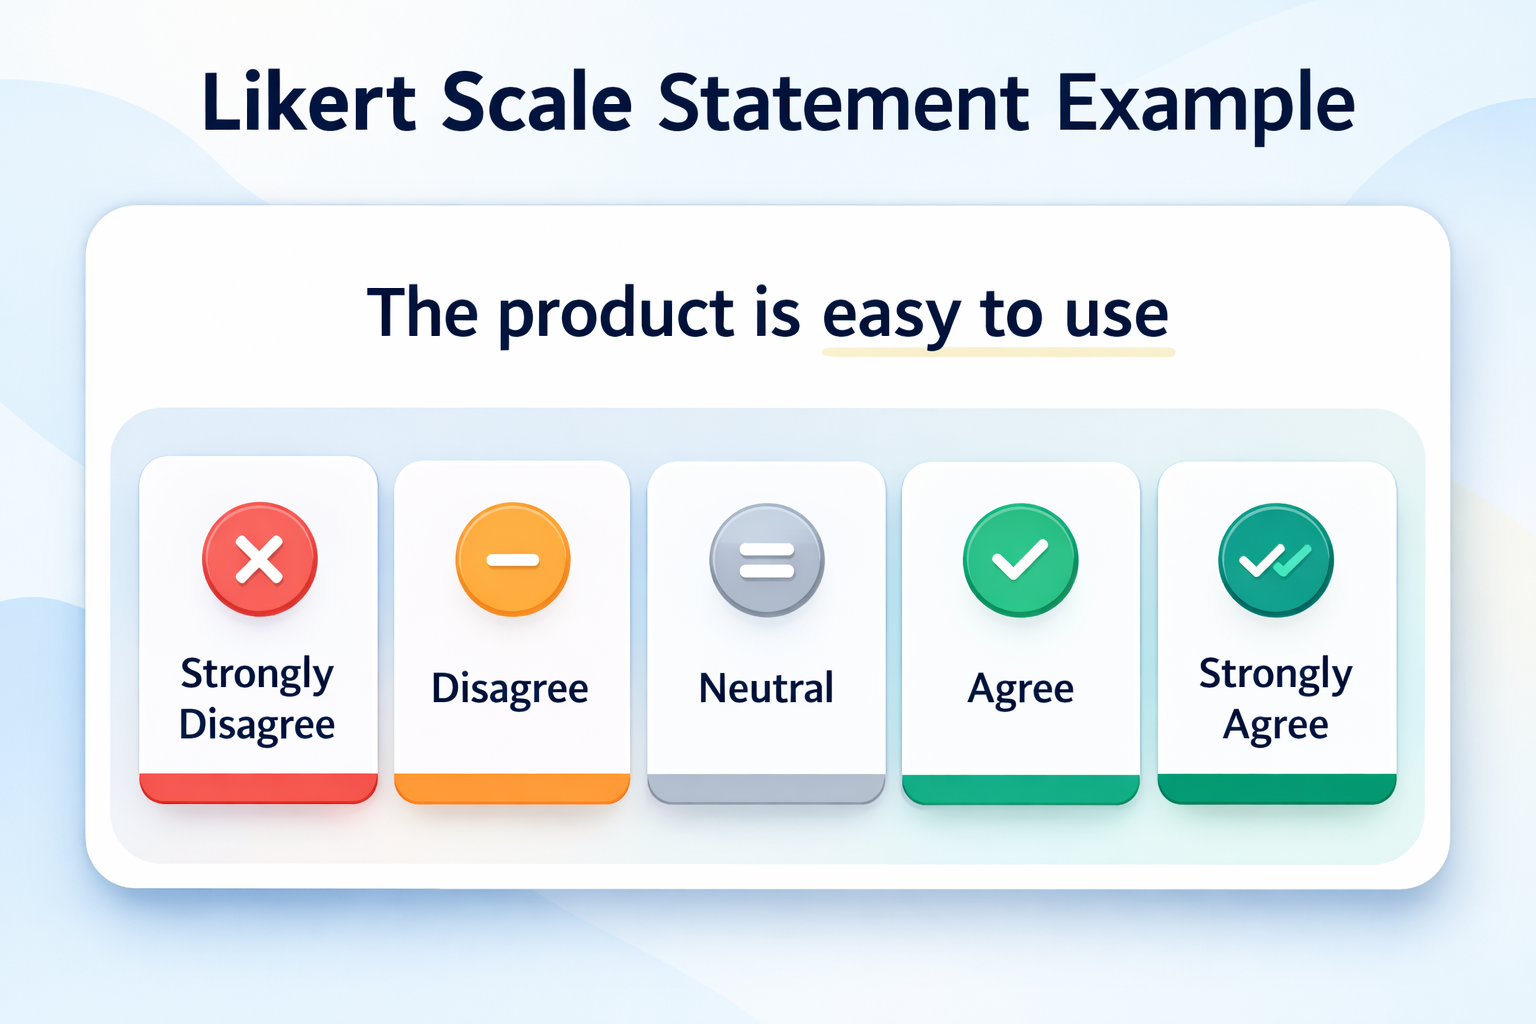
A Likert rating scale presents a statement and asks respondents to select a response that reflects how strongly they agree or disagree with it.
For example:
Statement: “The product is easy to use.”
Likert scale responses:
Each response represents a different level of sentiment. Because these responses are ordered, they allow researchers to analyze attitudes quantitatively. This format is why the Likert-style rating scale has become one of the most widely used survey tools.
The scale was developed by Rensis Likert, an American social psychologist, in 1932 as a method to measure attitudes in social science research.
Before Likert’s work, surveys often relied on simple yes/no questions. Likert introduced a multi-point response structure that allowed researchers to measure degrees of agreement rather than binary opinions.
Today, the Likert rating scale remains a foundational tool in:
According to research cited by CustomerThermometer, reliability increases when scales move from two options toward five or seven response points, with little statistical benefit beyond seven points.
Organizations rely on Likert scale survey questions because they provide a simple way to convert subjective opinions into structured data. Instead of asking open-ended questions that are difficult to analyze, a Likert scale allows respondents to quickly select a response that reflects their sentiment. Researchers can then analyze these responses to understand patterns across a large group of participants.
For example, survey responses can be analyzed to identify:
As survey research experts often emphasize, frequency distribution and median values are commonly used when interpreting Likert responses because the data is ordinal in nature.
This ability to convert opinions into measurable data is what makes the Likert-style rating scale one of the most widely used measurement tools in surveys today.
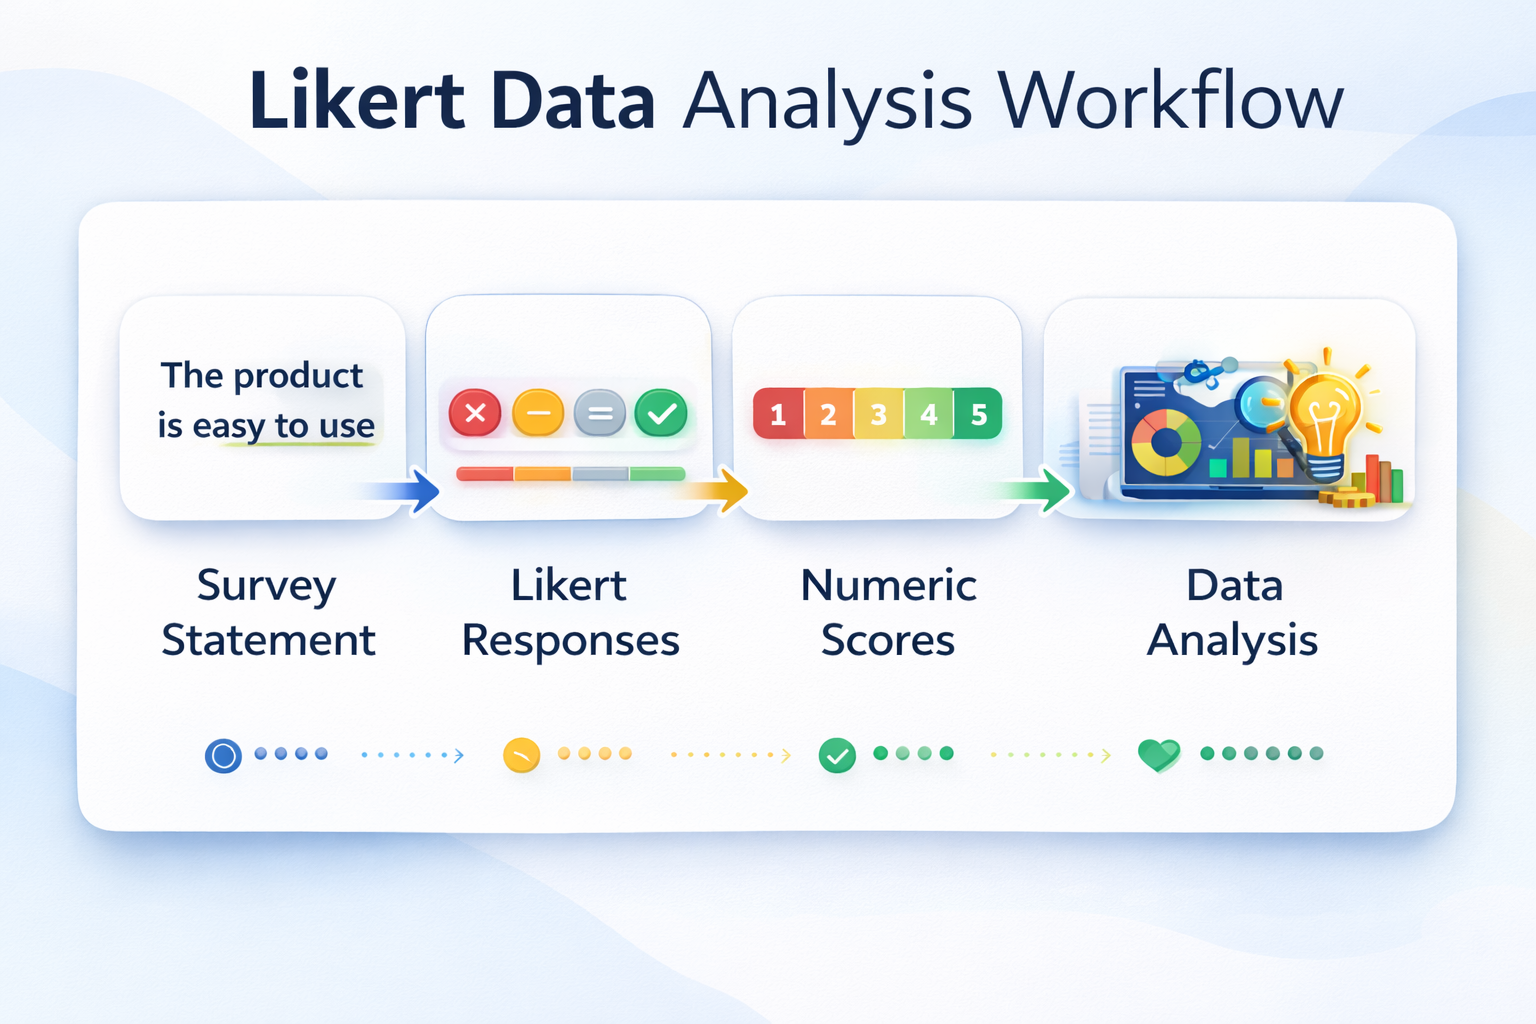
A Likert-style rating scale works by assigning ordered response options to a statement so that respondents can express how strongly they agree, disagree, or feel about it.
Instead of collecting simple yes/no answers, the Likert rating scale captures degrees of sentiment. This allows survey designers to measure attitudes, satisfaction levels, and perceptions in a structured format.
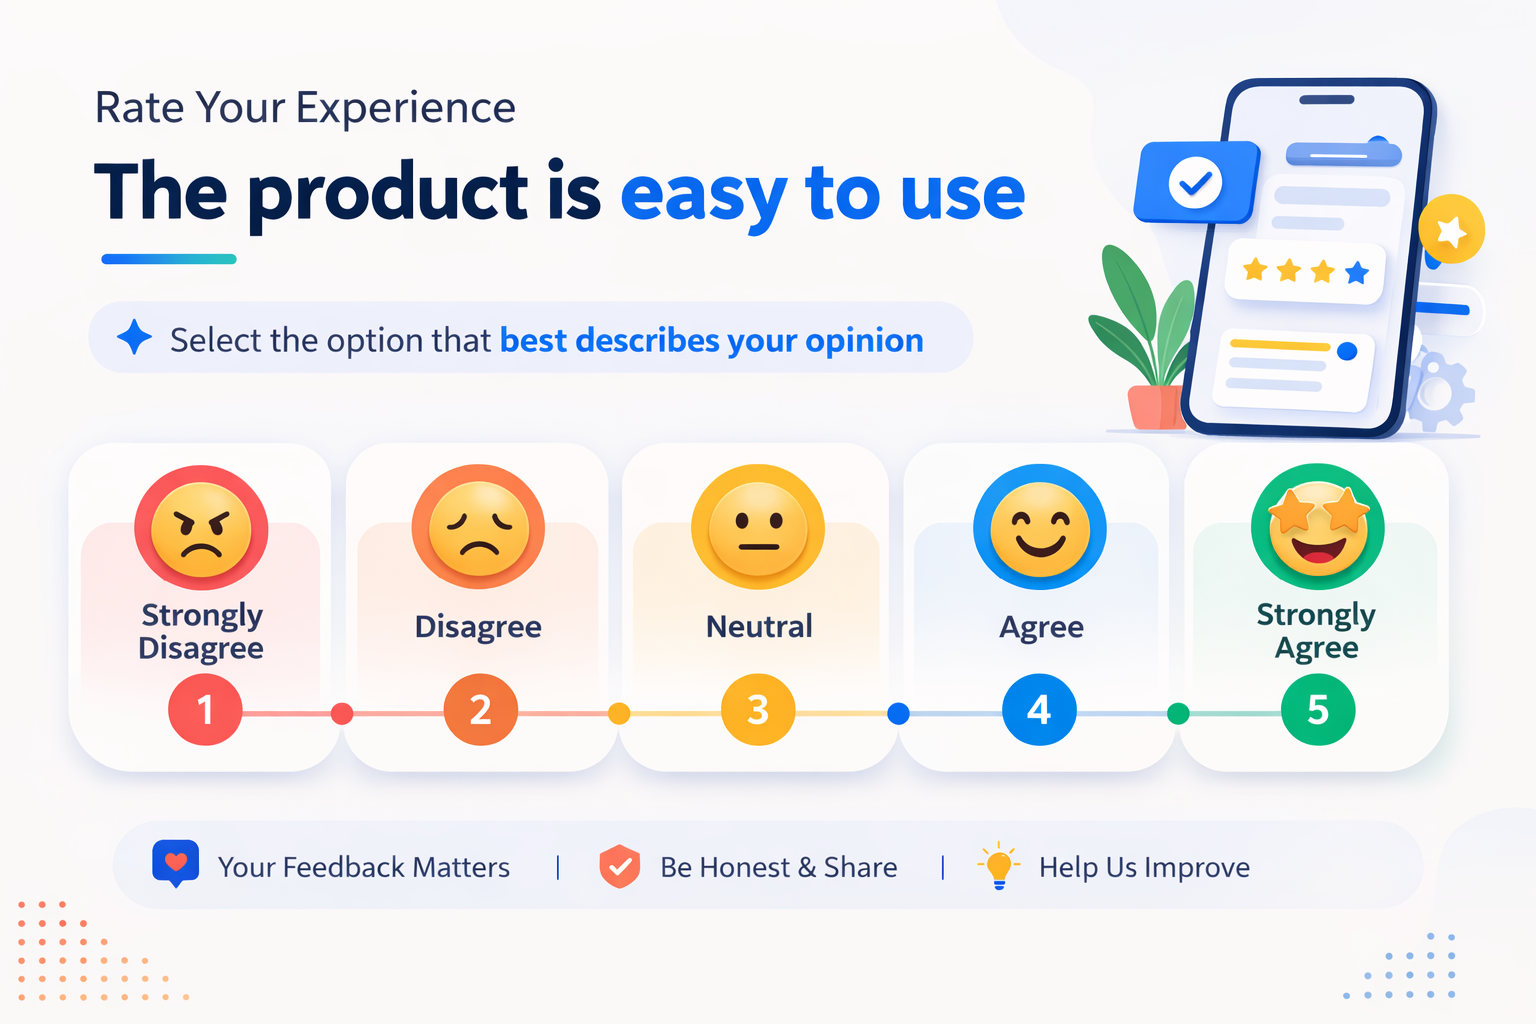
For example, consider the statement:
“The product is easy to use.”
Respondents select one option from the Likert scale based on their opinion.
These numeric values allow researchers to analyze responses quantitatively.
Once responses are collected, survey teams convert the Likert scale answers into structured data.
This makes it possible to analyze feedback in several ways:
Average Scores
Researchers calculate the average score for a question to understand overall sentiment.
Response Distribution
The number of responses in each category shows whether opinions are mostly positive, neutral, or negative.
Trend Analysis
Organizations can track Likert responses over time to see whether satisfaction or engagement is improving.
Group Comparisons
Likert data can be compared across different groupsfor example departments, customer segments, or geographic regions.
According to survey research guidance from SurveyMonkey, analysts typically examine the frequency distribution first when interpreting Likert data to understand whether responses are skewed toward positive or negative sentiment.
The main reason Likert-style rating scales are so widely used is that they balance simplicity and analytical value.
Respondents can answer quickly because the response options are easy to understand, while researchers gain structured data that can be analyzed statistically.
This is why Likert scales appear frequently in:
By converting opinions into measurable responses, the Likert rating scale helps organizations identify patterns in how people perceive experiences, services, or products.
One of the reasons the Likert-style rating scale is widely used in surveys is its flexibility. The format works across many industries and research scenarios because it allows respondents to evaluate statements using a structured scale.
Instead of asking vague questions, Likert survey questions present a clear statement and ask participants to indicate how strongly they agree or disagree.
This approach helps researchers and organizations measure attitudes in a consistent way.
Below are several practical Likert scale examples used in real survey environments.
Customer experience teams frequently use Likert rating scales to measure satisfaction with a product or service.
Example statement:
“The checkout process was easy to complete.”
Typical response scale:
By collecting responses from many customers, organizations can identify whether the checkout experience is working well or causing friction.
When many respondents choose negative responses, it signals a potential usability problem that needs improvement.
HR teams often use Likert scale survey questions to measure workplace engagement and employee sentiment.
Example statement: “I feel recognized for my contributions at work.”
Response scale:
Employee engagement surveys frequently contain multiple Likert items that measure different aspects of the workplace experience, such as leadership support, communication, and career development.
Combining several questions allows organizations to create engagement indexes or satisfaction scores.
Product teams also rely heavily on Likert-style rating scales to understand how users perceive features or usability.
Example statement:
“The mobile app is easy to navigate.”
Response scale:
This type of feedback helps product teams identify usability issues and prioritize improvements in future updates.
When designing Likert survey questions, it is important to ensure that each statement measures only one idea at a time.
For example:
Poor question
“The product is affordable and easy to use.”
This question measures two different thingsprice and usabilitymaking responses harder to interpret.
Better question
“The product is easy to use.”
Clear, single-focus statements make Likert scale data easier to analyze and more reliable.
In the next section, we’ll explore the difference between 5-point and 7-point Likert scales and how to choose the right format for your survey.
One of the most common design decisions when creating a Likert-style rating scale is choosing how many response options to include.
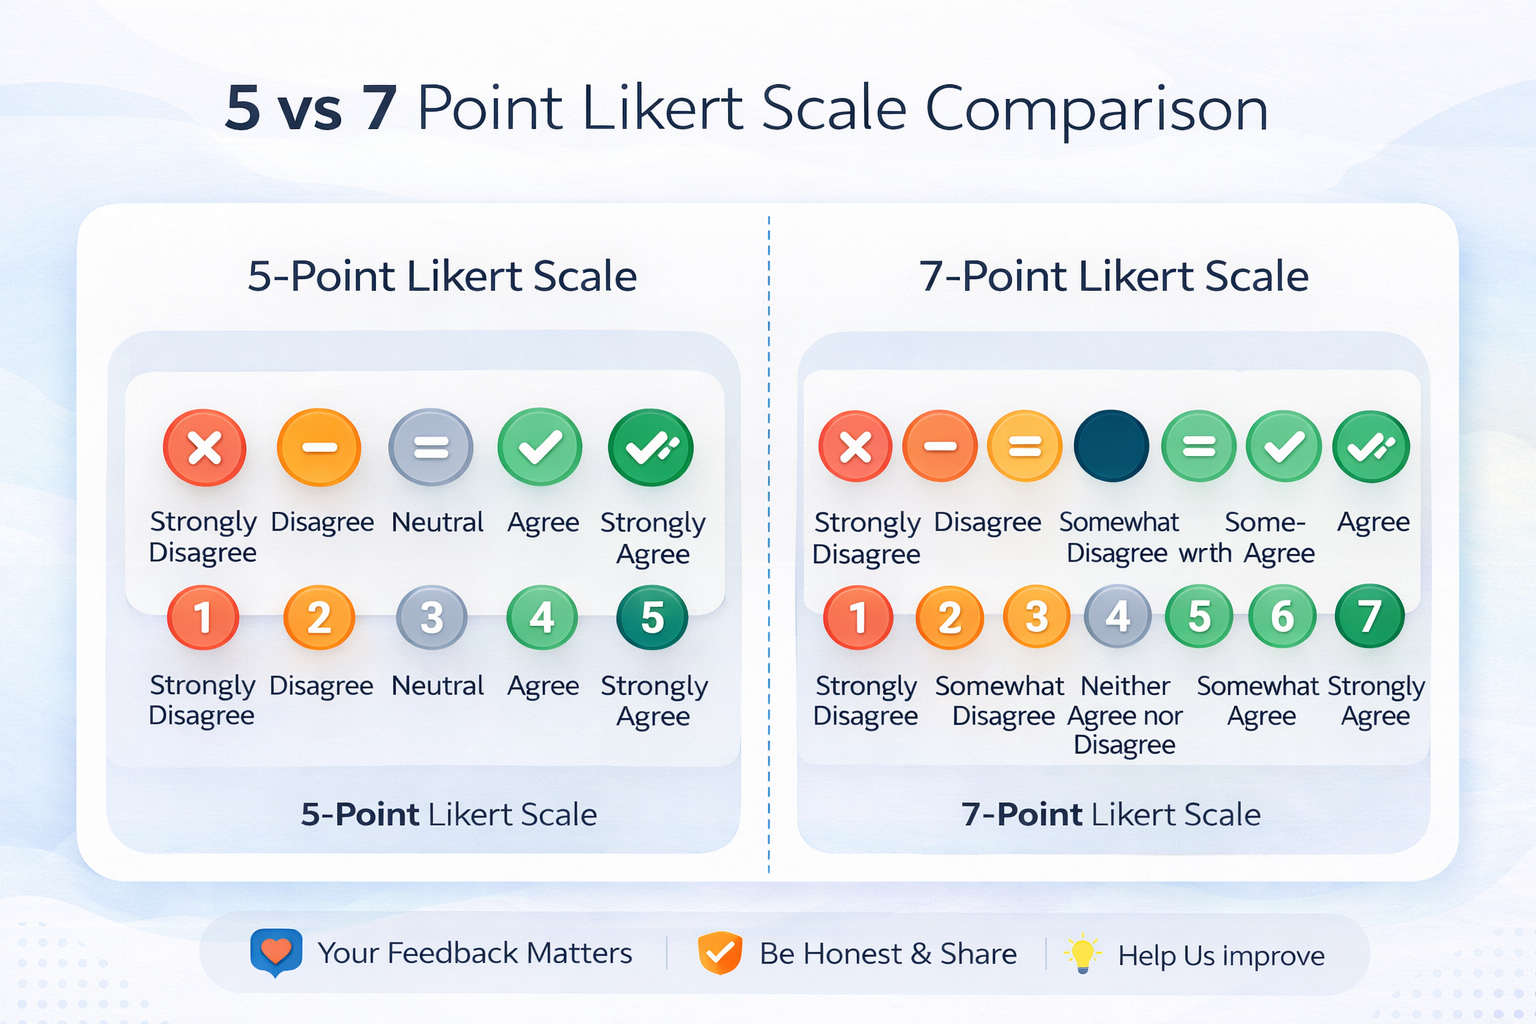
The two most widely used formats are 5-point Likert scales and 7-point Likert scales. Both measure sentiment toward a statement, but they differ in the level of detail they capture.
Choosing the right scale depends on the type of survey and how precise you want the responses to be.
The 5-point Likert scale is the most commonly used format in business surveys.
A typical structure looks like this:
This format is popular because it is easy for respondents to understand and quick to complete.
Many customer experience surveys, employee feedback questionnaires, and product satisfaction studies use a 5-point scale because it keeps surveys simple while still capturing meaningful sentiment.
Advantages of the 5-point Likert rating scale include:
Because of its simplicity, the 5-point scale is often recommended for customer satisfaction surveys and product feedback studies.
The 7-point Likert scale expands the response range to capture more nuanced opinions.
A typical 7-point structure includes:
This format allows respondents to express more subtle differences in sentiment.
Researchers often prefer the 7-point scale because it provides greater measurement sensitivity.
Research frequently cited in survey methodology suggests that reliability improves as response options increase from two points to around seven, with little statistical benefit beyond that.
Advantages of the 7-point Likert scale include:
For this reason, 7-point Likert scales are often used in academic research and detailed market studies.
In practice, the choice between a 5-point vs 7-point Likert scale depends on the purpose of the survey.
Use a 5-point scale when:
Use a 7-point scale when:
Both formats remain widely used in survey research, customer experience programs, and employee engagement studies.
In the next section, we’ll explore another important survey design decision: whether to include a neutral option or force respondents to choose a positive or negative direction.
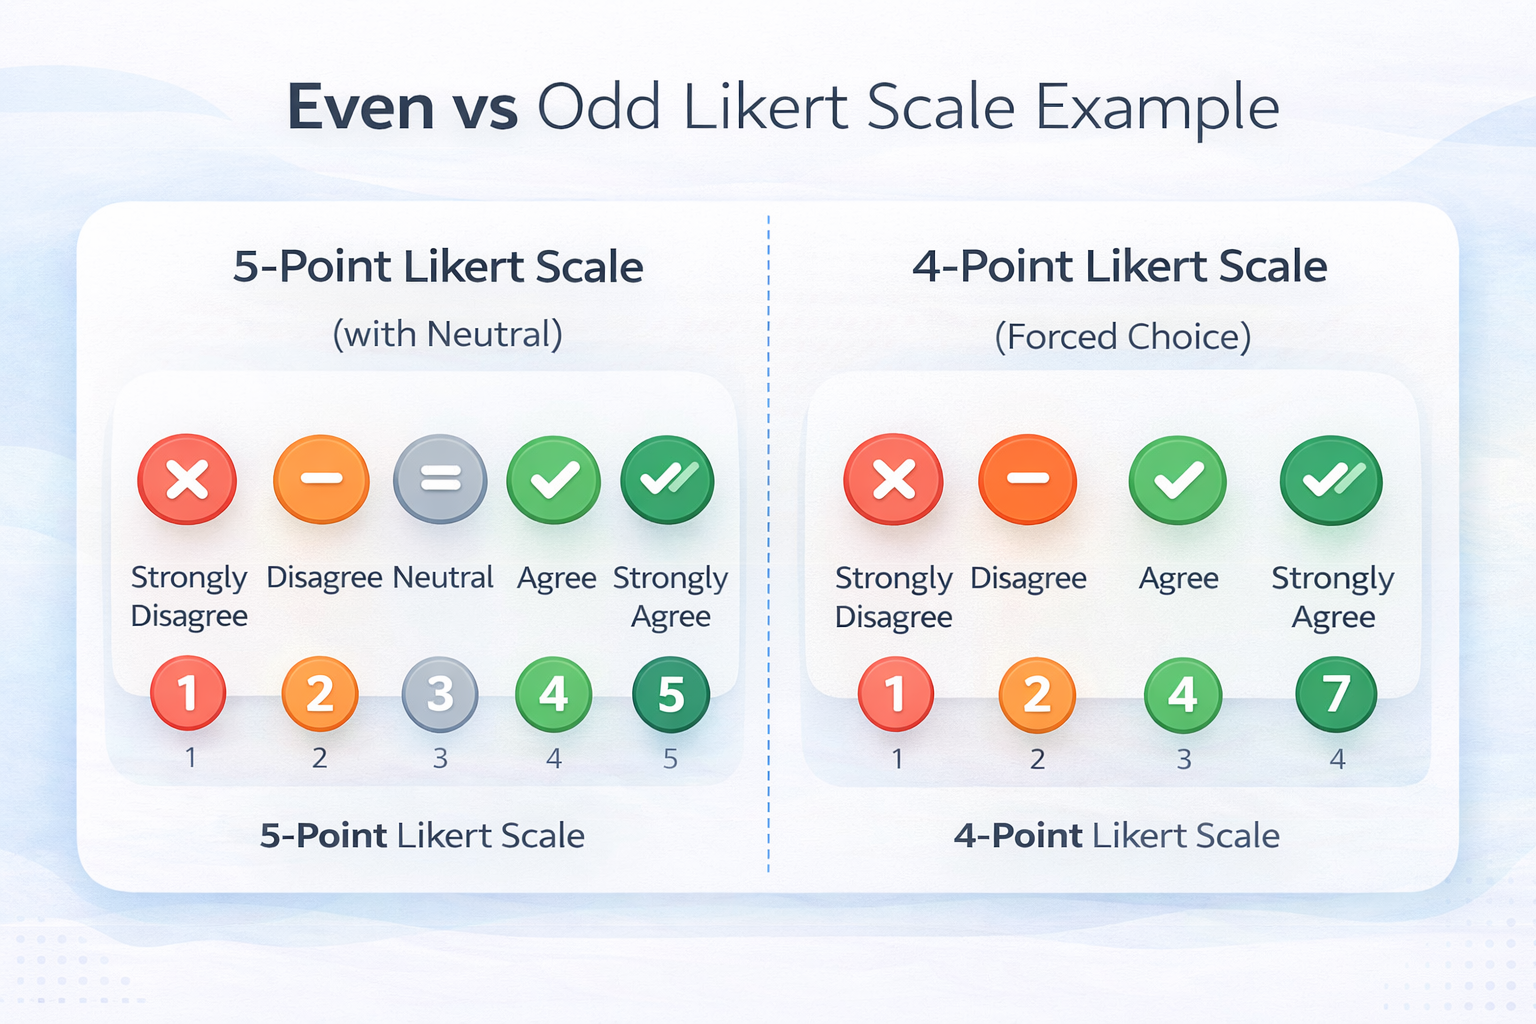
When designing a Likert-style rating scale, another important decision is whether to include a neutral option or force respondents to choose a positive or negative direction.
This decision creates two main types of Likert scales: odd-numbered scales and even-numbered scales.
Each approach influences how respondents interpret survey questions and how the results are analyzed.
Odd-numbered Likert scales include a neutral middle option that allows respondents to express a balanced or undecided opinion.
Common examples include:
Example structure:
The neutral option allows respondents to select a middle position when they do not have a strong opinion.
Benefits of odd-numbered Likert scales include:
Because of these advantages, odd-numbered Likert scales are widely used in customer satisfaction surveys and employee engagement research.
Even-numbered Likert scales remove the neutral option and require respondents to choose either a positive or negative direction.
Common examples include:
Example structure:
Without a neutral option, respondents must take a position on the statement.
Advantages of even-numbered Likert scales include:
For example, some researchers prefer 4-point Likert scales when they want respondents to express a clear preference instead of selecting a neutral response.
Both approaches can be effective depending on the goal of the survey.
Use odd Likert scales when:
Use even Likert scales when:
Understanding these differences helps survey designers choose the most appropriate Likert rating scale structure for their research goals.
In the next section, we’ll explore best practices for designing effective Likert scales so that survey responses remain reliable and easy to analyze.
A Likert-style rating scale is powerful because it converts opinions and perceptions into measurable data. However, poorly designed scales can produce misleading results.
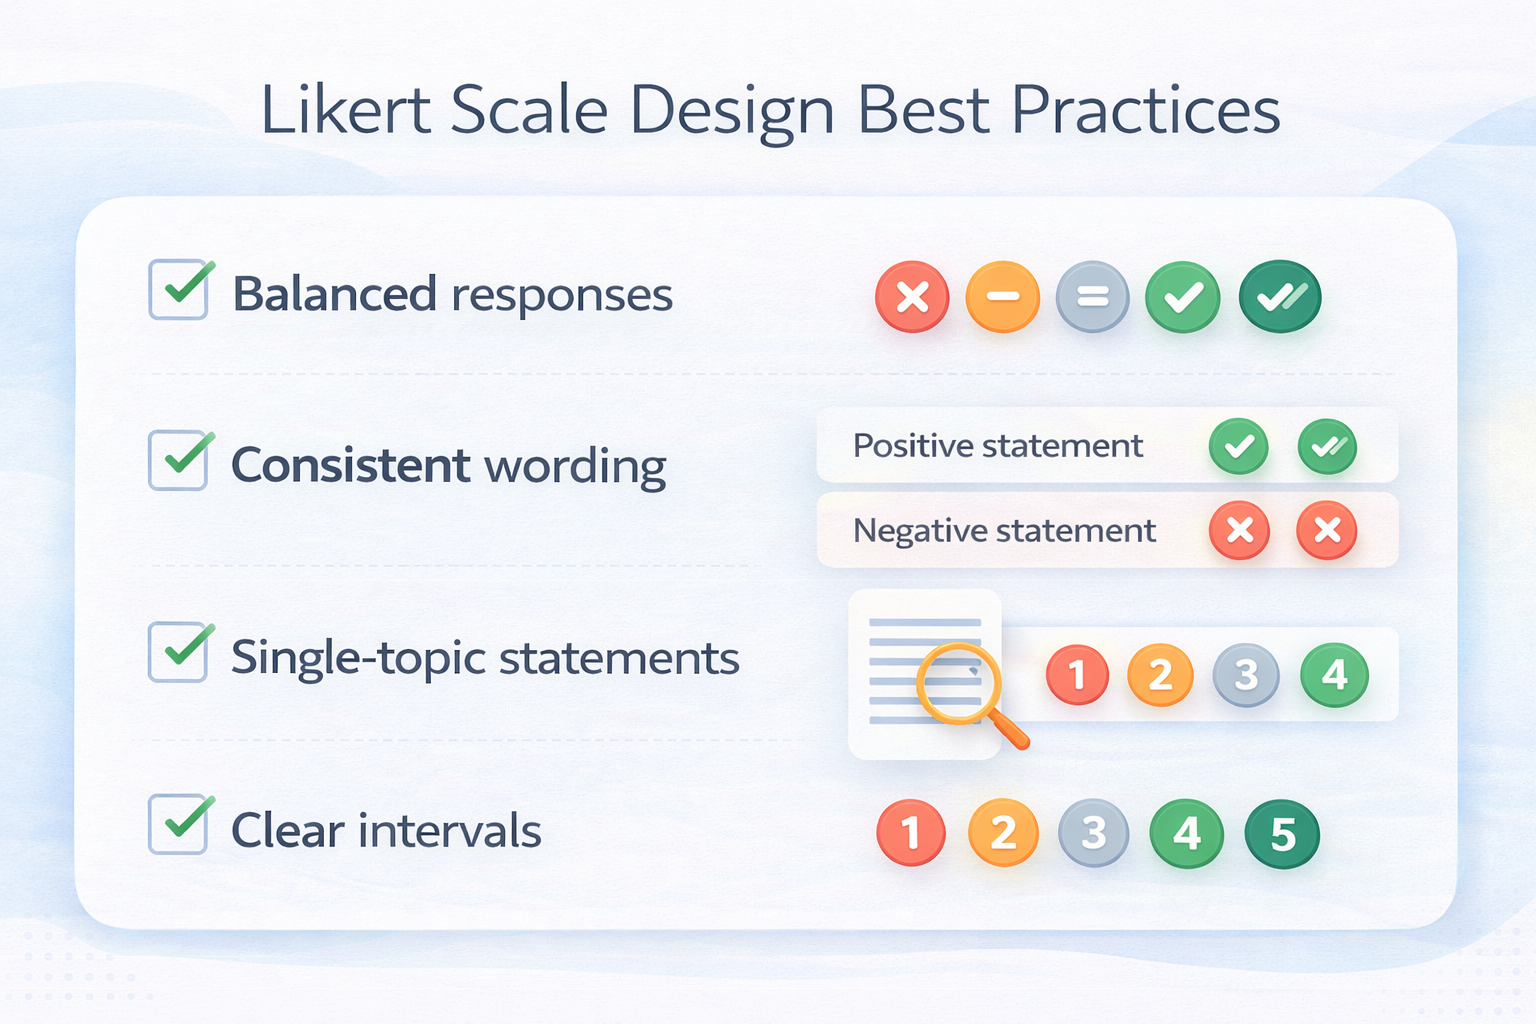
To collect reliable insights, surveys must follow a few important Likert scale design best practices. These practices help ensure that respondents understand the questions clearly and that the resulting data can be analyzed accurately.
A well-designed Likert rating scale should include balanced positive and negative options.
For example:
This symmetry ensures that respondents have equal opportunity to express positive or negative sentiment. Balanced scales also make it easier to analyze sentiment trends across survey responses.
Consistency is important when using multiple Likert scale survey questions.
For example, if one question uses the scale:
Strongly disagree → Strongly agree
then the same wording should be used across all similar questions.
Changing the response structure throughout a survey can confuse respondents and reduce data reliability.
Each response option in a Likert-style rating scale should represent a similar step in sentiment.
For example:
Each option reflects a gradual change in agreement.
This consistency helps ensure that responses represent meaningful differences in opinion, making statistical analysis more accurate.
A common survey design mistake is combining two ideas into one statement.
For example:
Bad example
“The product is affordable and easy to use.”
If a respondent thinks the product is easy to use but not affordable, they may struggle to answer accurately.
A better approach is to separate the ideas into two questions:
“The product is easy to use.”
“The product is affordable.”
This approach produces cleaner and more reliable survey data.
Surveys should avoid switching between different rating formats unnecessarily.
For example, moving from a 5-point Likert scale to a 10-point rating scale within the same questionnaire can create confusion.
Maintaining a consistent Likert rating scale structure helps respondents answer more confidently and improves overall survey reliability.
Even small design choices can influence survey responses.
Research in survey methodology has shown that wording, visual layout, and scale structure can affect how respondents interpret questions.
By following proven Likert scale design best practices, organizations can collect feedback that is both accurate and easier to analyze.
In the next section, we’ll explore how to analyze Likert scale data and convert survey responses into meaningful insights.
Once responses are collected using a Likert-style rating scale, the next step is turning those responses into insights. Because Likert responses are structured and ordered, they allow researchers and organizations to analyze sentiment patterns across a large group of respondents.
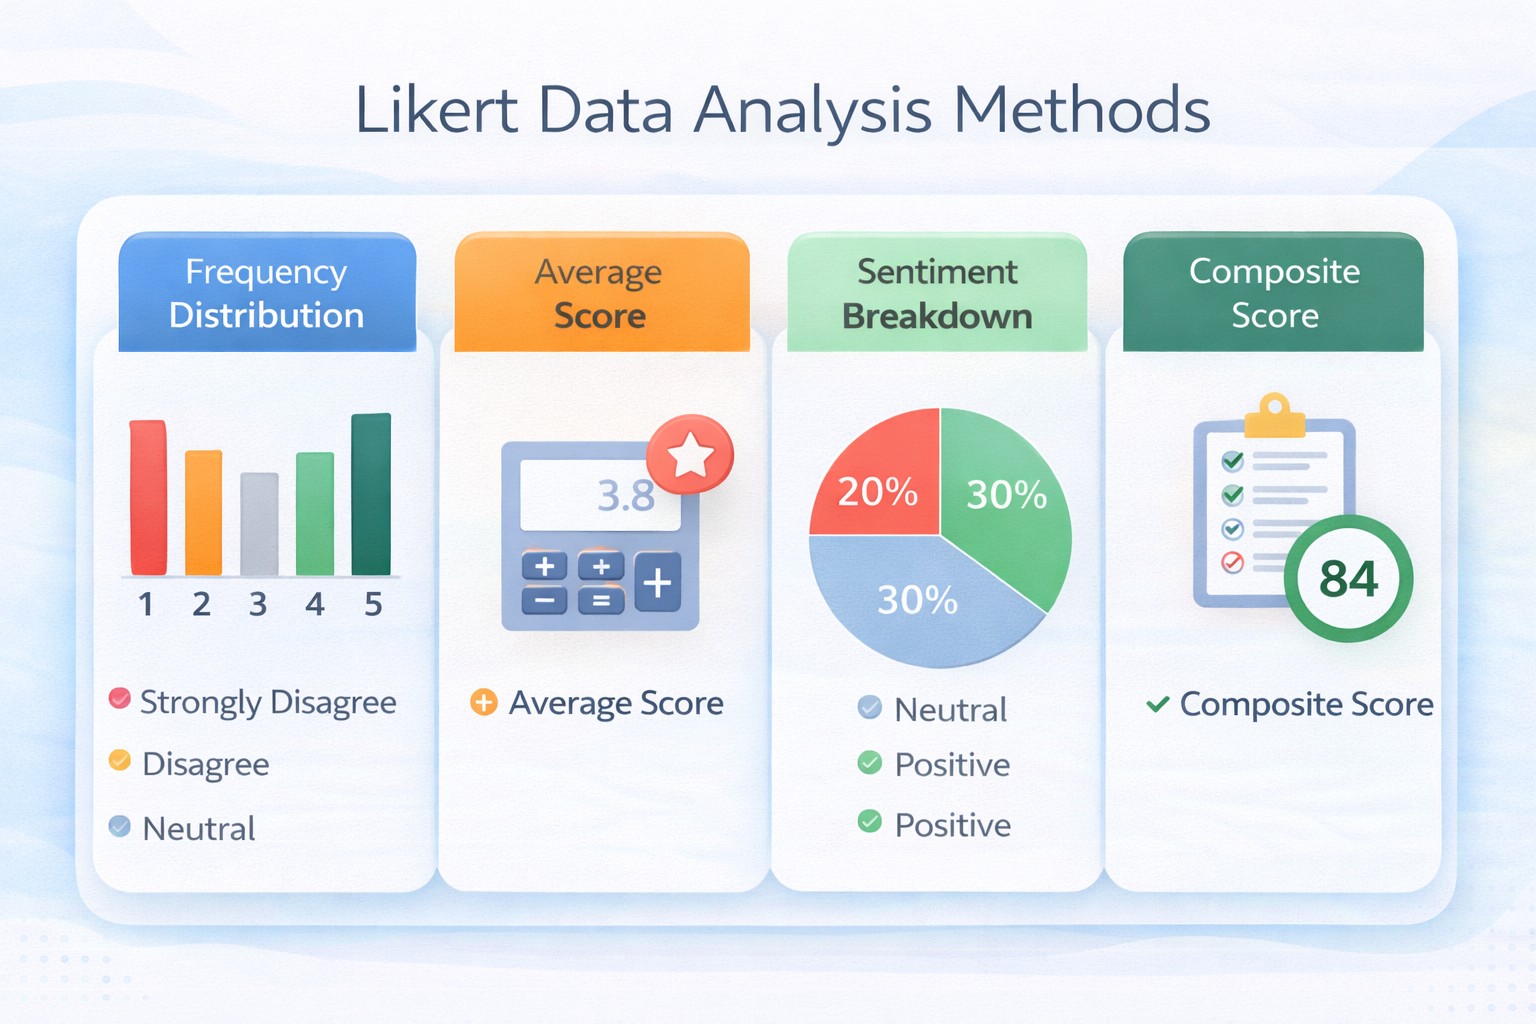
Understanding how to analyze Likert scale data helps survey teams identify trends, measure satisfaction, and compare results across different audiences.
One of the simplest ways to analyze Likert scale survey results is through frequency distribution.
This method counts how many respondents selected each response option.
For example:
By reviewing this distribution, researchers can quickly see whether responses are mostly positive, neutral, or negative.
Survey analysis experts often recommend starting with frequency distribution because it provides a clear overview of sentiment patterns.
Another common method for analyzing Likert rating scale data is calculating the average score.
Each response option is assigned a numeric value.
Example:
Researchers can then calculate the average score across all responses.
For example, if the average score for a satisfaction question is 4.2, this suggests a generally positive sentiment among respondents.
While averages are commonly used, many researchers also recommend reviewing medians and distributions to better interpret ordinal Likert data.
Another useful approach is dividing responses into sentiment categories.
Typical groupings include:
Positive responses
Neutral responses
Negative responses
This breakdown helps organizations understand overall sentiment at a glance.
For example, a survey might reveal:
This approach is often used in customer satisfaction surveys and employee engagement research.
In many surveys, researchers combine multiple Likert questions into a composite score or index.
For example, a customer satisfaction index might combine several Likert items such as:
By combining multiple items, researchers can create a more reliable measurement of overall sentiment.
Survey analysis tools such as Excel, SPSS, or modern survey analytics platforms often automate these calculations.
When analyzed correctly, Likert scale data can reveal patterns that help organizations improve experiences.
Survey teams can use Likert analysis to:
This ability to convert opinions into measurable insights is why Likert scales remain one of the most powerful tools in survey research and feedback analysis.
In the next section, we’ll explore how Likert scales are used in real-world survey research across industries.
The Likert-style rating scale is one of the most widely used tools in survey research and feedback analysis. It allows researchers and organizations to convert opinions, attitudes, and experiences into structured data that can be analyzed.
Because the scale captures levels of agreement or sentiment, it works well for studying topics that are otherwise difficult to measure such as satisfaction, trust, engagement, or perception.
In simple terms, Likert scales help transform subjective opinions into measurable insights.
Many organizations use a Likert rating scale to measure customer experience.
For example, a company may include questions like:
“The checkout process was easy to complete.”
“The support team resolved my issue quickly.”
Each statement is followed by a Likert-style rating scale such as:
These responses allow customer experience teams to measure satisfaction levels and identify areas where improvements are needed.
Research organizations such as Pew Research Center have highlighted that structured survey scales are widely used to measure public attitudes and perceptions across industries.
Human resources teams also rely heavily on Likert scale survey questions when measuring employee engagement.
For example:
“I feel recognized for my contributions at work.”
Employee engagement surveys often include multiple Likert items covering topics like:
According to industry research on employee surveys, engagement programs that use structured feedback methods often achieve response rates above 70%, making them one of the most reliable ways to understand workplace sentiment.
Product teams frequently use Likert-style rating scales to evaluate product usability and feature performance.
Example product feedback statement:
“The mobile app is easy to navigate.”
Using a Likert scale survey, product managers can analyze patterns such as:
These insights help product teams prioritize improvements based on real user feedback.
Beyond business applications, Likert scales are widely used in academic and social research.
Researchers use them to study topics such as:
Because the responses follow an ordered structure, Likert data can be analyzed using statistical methods such as:
This makes Likert scale survey research one of the most practical tools for collecting large-scale opinion data.
The reason Likert-style rating scales remain popular across industries is simple.
They make it possible to:
When designed correctly, a Likert rating scale survey becomes a powerful tool for understanding experiences and improving decision-making.
In the final section, we’ll summarize the key ideas behind Likert scales and explain why they continue to be one of the most valuable tools in modern survey research.

A Likert scale is a structured rating method used in surveys to measure opinions, attitudes, or perceptions. Respondents indicate their level of agreement with a statement using a scale such as strongly disagree to strongly agree. The Likert-style rating scale was originally developed by psychologist Rensis Likert in 1932 to study attitudes in social research. Today, it is widely used in customer feedback surveys, employee engagement research, and market studies.
A common Likert scale survey question presents a statement and asks respondents to rate their agreement.
Example:
“The checkout process on the website was easy to complete.”
Typical response options include:
This format allows researchers to measure sentiment in a structured way.
A 5-point Likert scale uses five response options and is commonly used in customer satisfaction surveys because it is simple and easy to complete. A 7-point Likert scale provides additional response options such as slightly agree or slightly disagree, allowing for more nuanced opinions. Research in survey methodology suggests that reliability improves up to seven response points, but adding more options beyond that typically does not increase accuracy.
To analyze Likert scale survey data, researchers typically use methods such as:
These techniques help organizations identify trends in customer satisfaction, employee engagement, or product feedback.
Likert scales are widely used because they make it easier to quantify opinions and attitudes. Instead of collecting only open-ended responses, organizations can analyze patterns across thousands of responses using structured data. This makes Likert-style rating scales especially useful for customer experience programs, employee engagement surveys, and product research.
Yes. Likert scale surveys are commonly used in both customer experience (CX) and employee engagement programs. CX teams often use them to measure satisfaction, loyalty, or product usability, while HR teams use them to understand employee morale, workplace culture, and leadership effectiveness. Because responses follow a consistent scale, organizations can track changes in sentiment over time.
Likert scales collect ordinal quantitative data, meaning responses follow an ordered scale such as strongly disagree to strongly agree. However, they often capture subjective experiences or perceptions, which makes them valuable for analyzing attitudes and opinions. Researchers typically combine Likert data with open-ended responses to gain both quantitative trends and qualitative insights.
.png)
.svg)


