.png)
If More Customers Respond, Does That Automatically Mean Better Insights?
Most customer experience teams celebrate response rate.
The dashboard shows participation increasing. Leadership sees more survey responses arriving every month. Research teams report growing engagement, and the immediate assumption is that feedback quality has improved.
But customer experience measurement is rarely that simple. What if most respondents abandon the survey halfway through? What if only highly satisfied customers participate? What if the feedback collected is incomplete, unbalanced, or difficult to act upon?
These questions explain why response rate and completion rate should never be treated as interchangeable metrics.
Although both are survey health indicators, they measure completely different stages of customer participation. One measures whether customers are willing to engage. The other measures whether the experience of providing feedback is good enough to complete.
As customer experience programs mature, this distinction becomes increasingly important. Organizations are no longer judged by how much feedback they collect. They are judged by how effectively that feedback improves decisions, customer journeys, and business outcomes.
As Amitayu Basu, CEO & Co-founder of NUMR Inc. explains:
"Response rate tells you who started talking. Completion rate tells you whether the experience of giving feedback was good enough to finish."
That perspective aligns closely with the evolution of modern Customer Experience Management (CXM). Feedback collection is only the beginning. The real value comes from turning customer responses into usable intelligence that drives action.
According to SurveyMonkey's survey methodology research, response rate and completion rate represent two different measurement stages. Response rate measures participation relative to the invited audience, while completion rate measures engagement among those who already started the survey.
Understanding both metrics helps CX leaders answer a more meaningful question: Can we trust the feedback we're using to make decisions?
Although the terms are often used together, they answer very different business questions.
Response rate measures participation. Completion rate measures engagement. Together, they provide a more complete picture of feedback program health. This distinction is especially important in Customer Experience Management because collecting feedback and collecting usable feedback are not the same thing.
A survey program may attract thousands of respondents. If most abandon the survey before reaching critical questions, the resulting insights become less reliable. Conversely, a survey with excellent completion rates may still fail to represent the broader customer base if participation remains too low.
The strongest Voice of Customer (VoC) programs evaluate both metrics simultaneously because each reveals a different source of risk.
Response rate measures the percentage of invited customers who participate in a survey. It evaluates how effectively an organization generates feedback from its target audience.
According to AskAtest and Qualtrics survey methodology guidance, response rate is calculated by dividing completed survey responses by the total number of invited participants.
Response Rate (%) = Completed Surveys ÷ Total Invitations × 100
Example
In this example, 15 percent of invited customers provided feedback. That figure tells us something important about participation. It tells us nothing about what happened after respondents started the survey.
Response rate helps organizations understand whether customers are willing to engage with a feedback request.
Several factors influence participation levels:
According to SurveySparrow benchmark research cited in 2025 industry analyses, the average survey response rate across channels is approximately 33%, although performance varies significantly by survey type and collection method.
However, response rate should not be confused with feedback quality. A higher response rate means more people participated. It does not automatically mean the resulting data is complete, balanced, or actionable.
Within Customer Experience Management, response rate functions primarily as a participation signal. It helps organizations determine whether customers are willing to enter the feedback ecosystem.
Low response rates may indicate:
SurveyMonkey notes that low response rates can also increase the risk of nonresponse bias, where certain customer groups participate at much lower rates than others, potentially distorting findings and reducing confidence in decision-making.
This is why mature CX programs rarely evaluate response rate in isolation. Participation is important. Representation is even more important.
A survey with fewer responses but strong audience representation often generates more reliable business insight than a larger survey with significant participation bias.
That shift in thinking is becoming increasingly common across modern customer experience programs and reflects a broader move away from measuring survey success solely through volume.

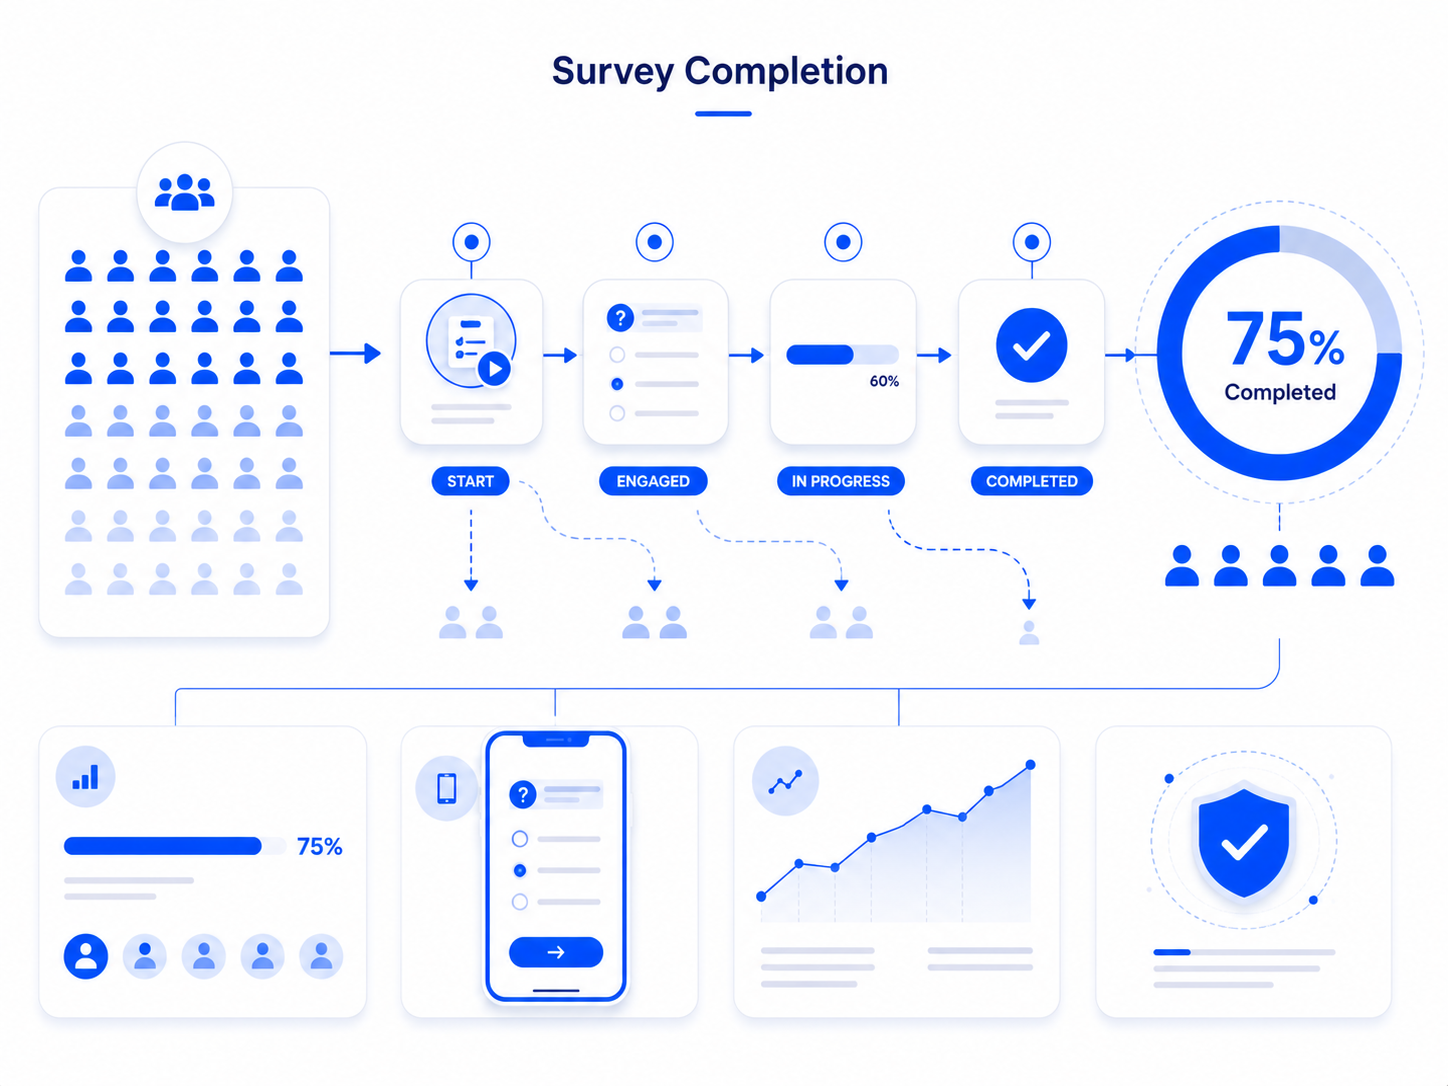
While response rate measures whether customers participate, completion rate measures whether they remain engaged long enough to finish the survey. In many ways, completion rate is a direct reflection of the survey experience itself.
According to Qualtrics, completion rate is calculated by dividing completed surveys by the total number of respondents who started the survey. Unlike response rate, it focuses on engagement after participation begins.
Completion Rate (%) = Completed Surveys ÷ Started Surveys × 100
Example
This means that 75% of respondents who started the survey remained engaged until the end. Unlike response rate, completion rate provides insight into the quality of the survey-taking experience.
Completion rate answers a different operational question: Was the survey experience good enough for customers to finish?
Several factors influence completion performance:
A respondent who starts but abandons a survey is still providing feedback. Their behavior signals friction. In many cases, abandonment reveals experience issues that organizations should investigate just as seriously as survey responses themselves.
This makes completion rate an important engagement indicator within Voice of Customer programs.
Completion rate is often treated as a secondary metric. In reality, it is frequently one of the strongest indicators of feedback quality.
A customer who completes a survey provides:
Customers who abandon surveys leave gaps that can reduce confidence in reporting and decision-making. This is why mature CX programs increasingly evaluate survey quality alongside participation volume.
As Samudra Gupta, CTO & Co-founder of NUMR Inc. explains:
"Both metrics matter. A high response rate with poor completion can still produce weak data quality."
That distinction is becoming increasingly important as organizations move toward decision-centric Customer Experience Management models.
Collecting more responses is useful. Collecting complete and usable responses is significantly more valuable.
According to Checker's State of CX Research 2025, leading CX teams are increasingly prioritizing response quality, feedback usability, and insight activation rather than focusing exclusively on response volume.
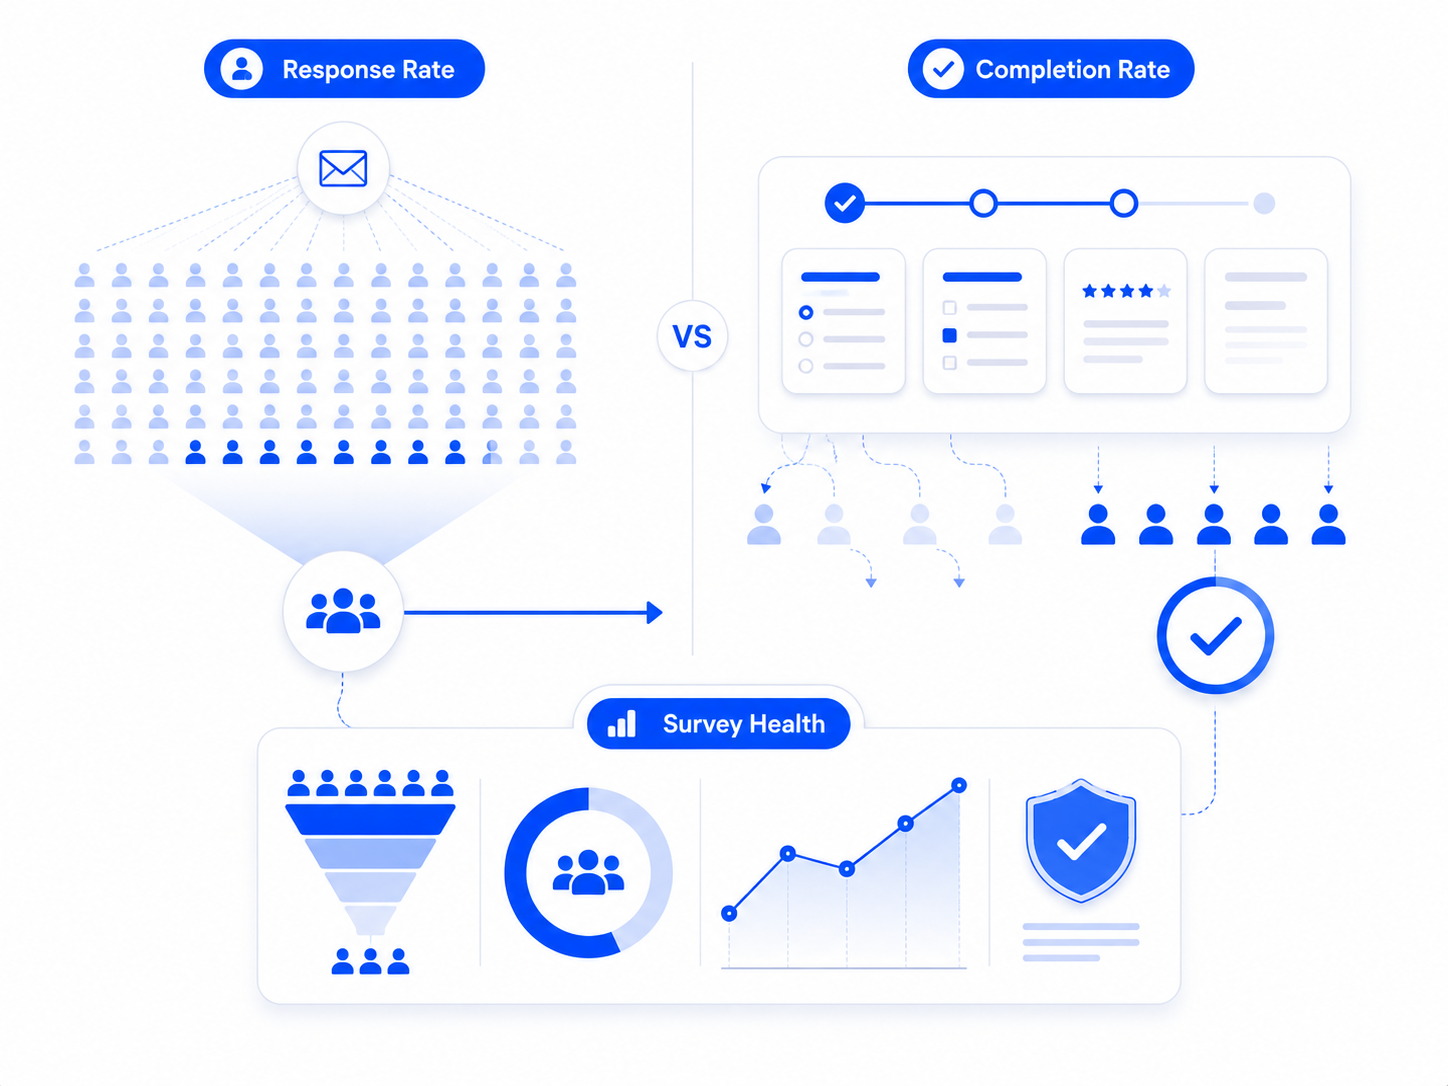
Understanding the difference becomes easier when both metrics are evaluated together. Although they appear similar, they measure different customer behaviors and reveal different improvement opportunities.
Response rate evaluates how successfully you invite customers into the feedback process. Completion rate evaluates how successfully you keep them engaged once they arrive. Together, they provide a more complete picture of survey health.
Imagine a customer experience survey sent to 1,000 customers.
Response Rate
90 ÷ 1,000 = 9%
Completion Rate
90 ÷ 150 = 60%
At first glance, these numbers may appear contradictory. But they reveal two different realities.
Only 9% of invited customers ultimately completed the survey.
This may indicate issues with:
Sixty percent of those who started the survey remained engaged until completion. This suggests the survey experience itself may be functioning reasonably well.
Without evaluating both metrics together, teams may incorrectly focus on the wrong problem. The survey may not need redesign. The invitation strategy may need improvement. That distinction can save significant time and resources.
One of the most common mistakes in survey reporting is prioritizing a single metric. Most often, that metric is response rate.
Participation is visible. Participation is easy to explain. Participation is easy to benchmark. However, survey success requires more than participation alone. It requires participation and engagement.
Consider this scenario:
At first glance, participation appears healthy. But most respondents abandon the survey before reaching completion.
This creates challenges such as:
According to SurveyMonkey, low completion rates frequently indicate excessive survey effort, poor organization, confusing questions, or weak user experience design. A strong response rate cannot compensate for poor completion quality.
Now consider the opposite situation.
The survey experience appears excellent. Almost everyone who starts finishes. However, participation remains limited.
Potential risks include:
According to SurveyMonkey's methodology guidance, low participation can affect representativeness and increase the likelihood that findings do not accurately reflect the broader customer population. Completion quality matters. Representation matters too.
This is why the strongest Voice of Customer programs monitor both metrics simultaneously rather than optimizing one at the expense of the other.
Historically, survey success was measured by response counts. More responses meant better performance. Modern CX programs are increasingly challenging that assumption.
A survey with:
may generate significantly better decision-making than a survey with:
The first survey produces fewer responses. But it produces more complete, more usable, and potentially more actionable feedback. The second survey generates volume. The first generates confidence.
For customer experience leaders, confidence is ultimately the more valuable outcome because confidence improves decision quality, prioritization, and business action.
That is why leading CX organizations increasingly evaluate feedback programs based not only on participation levels but also on the usability of the insight they generate.
Even mature customer experience programs sometimes misread response rate and completion rate. The problem is not usually the metrics themselves. The problem is how teams interpret them.
When participation and engagement metrics are viewed in isolation, organizations can easily draw the wrong conclusions and prioritize the wrong improvements.
Many dashboard reviews focus almost entirely on participation.
The conversation often sounds like this: "Response rate increased by 20%."
At first glance, that sounds like a success. However, participation growth becomes less meaningful if completion rates decline at the same time.
Imagine a survey program that doubles response rate but experiences a significant increase in abandonment. The organization may collect more responses overall, but the percentage of usable feedback could actually decrease.
This is why response rate should never be evaluated without completion rate. Participation tells you how many people entered the feedback process. Completion tells you how many provided usable insight. Both are necessary for decision confidence.
Many organizations treat abandonment as missing data. In reality, abandonment is feedback. Customers who exit a survey are communicating something about the survey experience itself.
Common causes include:
According to SurveyMonkey's survey design research, abandonment often reflects friction within the survey experience rather than a lack of willingness to provide feedback.
For CX leaders, drop-off analysis can be as valuable as response analysis because it highlights obstacles preventing customers from sharing their perspectives.
Response and completion rates vary dramatically across collection channels. A lower response rate on one channel does not automatically indicate poor performance.
Recent survey benchmark research shows significant variation across collection methods:
The important question is not whether one channel outperforms another. The important question is whether the channel performs effectively for its intended audience and use case.
A high response rate does not guarantee a representative sample. Some customer groups naturally participate more frequently than others.
For example:
This is why leading CX programs monitor:
Alongside traditional participation metrics.
Improving response rate focuses on increasing survey participation. The objective is simple: Get more customers to start. Several proven tactics consistently influence participation.
Feedback requests are generally more effective when sent close to the experience being evaluated. The shorter the delay between experience and invitation, the stronger the relevance.
Customers are more likely to participate when surveys feel personally relevant rather than generic. Personalization improves trust and increases perceived value.
Different audiences prefer different communication channels. Email may perform well for one customer segment while SMS performs better for another.
Excessive survey frequency can reduce willingness to participate. Customers who receive too many requests often stop responding entirely.
Customers are more likely to participate when organizations clearly explain:
Response-rate optimization is fundamentally an invitation strategy. Its purpose is increasing participation.

Completion-rate optimization focuses on improving the survey experience itself.
The objective is different: Get more customers to finish.
Survey length remains one of the strongest predictors of completion.
According to Gartner benchmark data, surveys containing fewer questions consistently achieve higher completion rates than longer surveys. Every unnecessary question introduces friction.
Customers should not have to interpret or decode questions. Simple language reduces effort and improves completion.
WifiTalents' 2026 survey benchmark analysis found that mobile completion rates can be significantly lower when surveys are not optimized for smaller screens and touch-based navigation.
Since mobile participation continues to grow, mobile usability is increasingly critical.
Questions should follow a natural progression. Poor sequencing increases abandonment and frustration.
Customers are more likely to finish when they understand how much effort remains. Progress bars reduce uncertainty and improve engagement.
Completion-rate optimization is fundamentally an experience-design challenge. Its purpose is increasing engagement quality.
One of the strongest lessons from modern CX dashboard design is that no single metric tells the full story.
According to NUMR's decision-centric dashboard philosophy, feedback programs should be evaluated across participation, engagement, quality, and decision layers.
Measures willingness to engage.
Key metrics include:
Measures willingness to remain engaged.
Key metrics include:
Measures confidence in feedback.
Key metrics include:
Measures business value.
Key metrics include:
This structure aligns feedback collection directly with Customer Experience Management outcomes rather than survey administration alone.
Many organizations still evaluate survey success primarily through response rate. NUMR takes a broader view.
A strong feedback program should optimize:
Response rate tells you whether customers are willing to engage. Completion rate tells you whether customers are willing to stay engaged. Neither metric is sufficient independently.
Together they help organizations understand whether the feedback being collected is trustworthy enough to guide customer experience decisions.
As customer experience programs become more sophisticated, success is increasingly defined by insight usability rather than response volume. The goal is not collecting more surveys. The goal is generating better decisions.
Response rate and completion rate measure different stages of customer participation. Response rate measures willingness to respond. Completion rate measures willingness to continue.
A strong response rate without strong completion can create incomplete and unreliable insight. A strong completion rate without sufficient participation can limit confidence and representativeness.
The most effective CX teams evaluate both metrics together because both influence the quality of customer intelligence flowing into decision-making.
The fundamental question is no longer: How many customers responded?
The more important question is: How much usable insight reached the people making decisions?
That is the metric that ultimately determines the success of a modern Customer Experience Management program.
Collecting more survey responses is only part of the challenge. The real opportunity is understanding whether your feedback program is generating complete, representative, and actionable insight.
Explore the Knowledge Center to learn more about response rates, completion rates, Voice of Customer programs, survey analytics, customer feedback dashboards, and CX measurement best practices.
Or Book a Demo to see how NUMR helps organizations monitor participation, completion, representation, insight quality, and customer experience performance from a single decision-centric CX platform.
Response rate measures the percentage of invited customers who submit a survey response.vCompletion rate measures the percentage of respondents who finish the survey after starting it.
Response rate evaluates participation, while completion rate evaluates engagement and survey experience quality.
Both metrics are important because they measure different stages of customer feedback collection.
Neither metric should be evaluated independently. A high response rate with low completion can produce incomplete or unreliable feedback.
A high completion rate with low response can create representativeness concerns and increase the risk of nonresponse bias.
The strongest CX programs optimize both metrics together because decision quality depends on participation and engagement.
Survey response rates vary by industry, audience, and channel.
Industry benchmarks commonly report:
The most important benchmark is not industry average alone but whether your response rate supports representative customer feedback and reliable decision-making.
Completion rates depend heavily on survey length, complexity, and channel.
Generally, completion rates above 70% indicate that most respondents find the survey manageable and relevant.
Lower completion rates often signal friction within the survey experience that may require investigation.
Survey abandonment is commonly caused by:
Analyzing drop-off behavior can help organizations identify experience issues that reduce engagement.
Yes. A survey may generate strong participation but still produce weak insight if:
This is why participation metrics should always be evaluated alongside completion, representation, and insight-quality measures.
Customer Experience Management depends on reliable customer insight. Response rate helps organizations understand customer willingness to participate.
Completion rate helps organizations understand customer willingness to remain engaged.
Together, these metrics help determine whether feedback is strong enough to support customer journey improvements, operational decisions, and business outcomes.
The most effective CX dashboards track both metrics alongside supporting indicators such as:
This approach provides a more complete view of feedback program health and supports stronger customer experience decision-making.

.png)
.svg)


