.png)
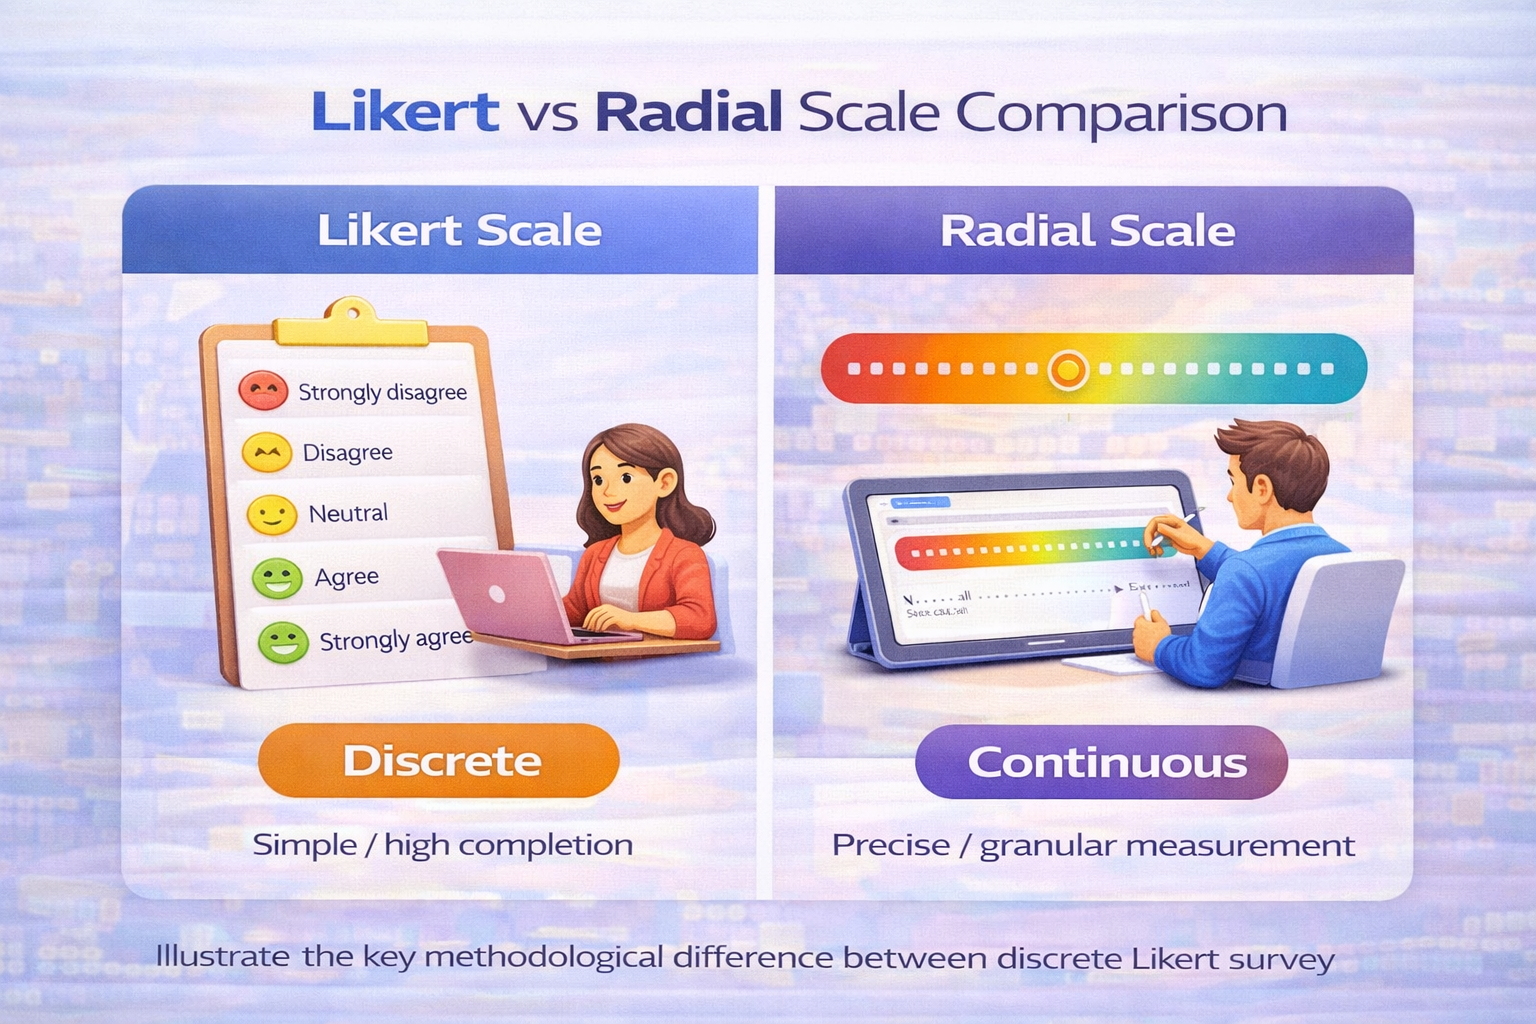
• Likert scales are the most widely used survey response format because they are simple, familiar, and produce high completion rates.
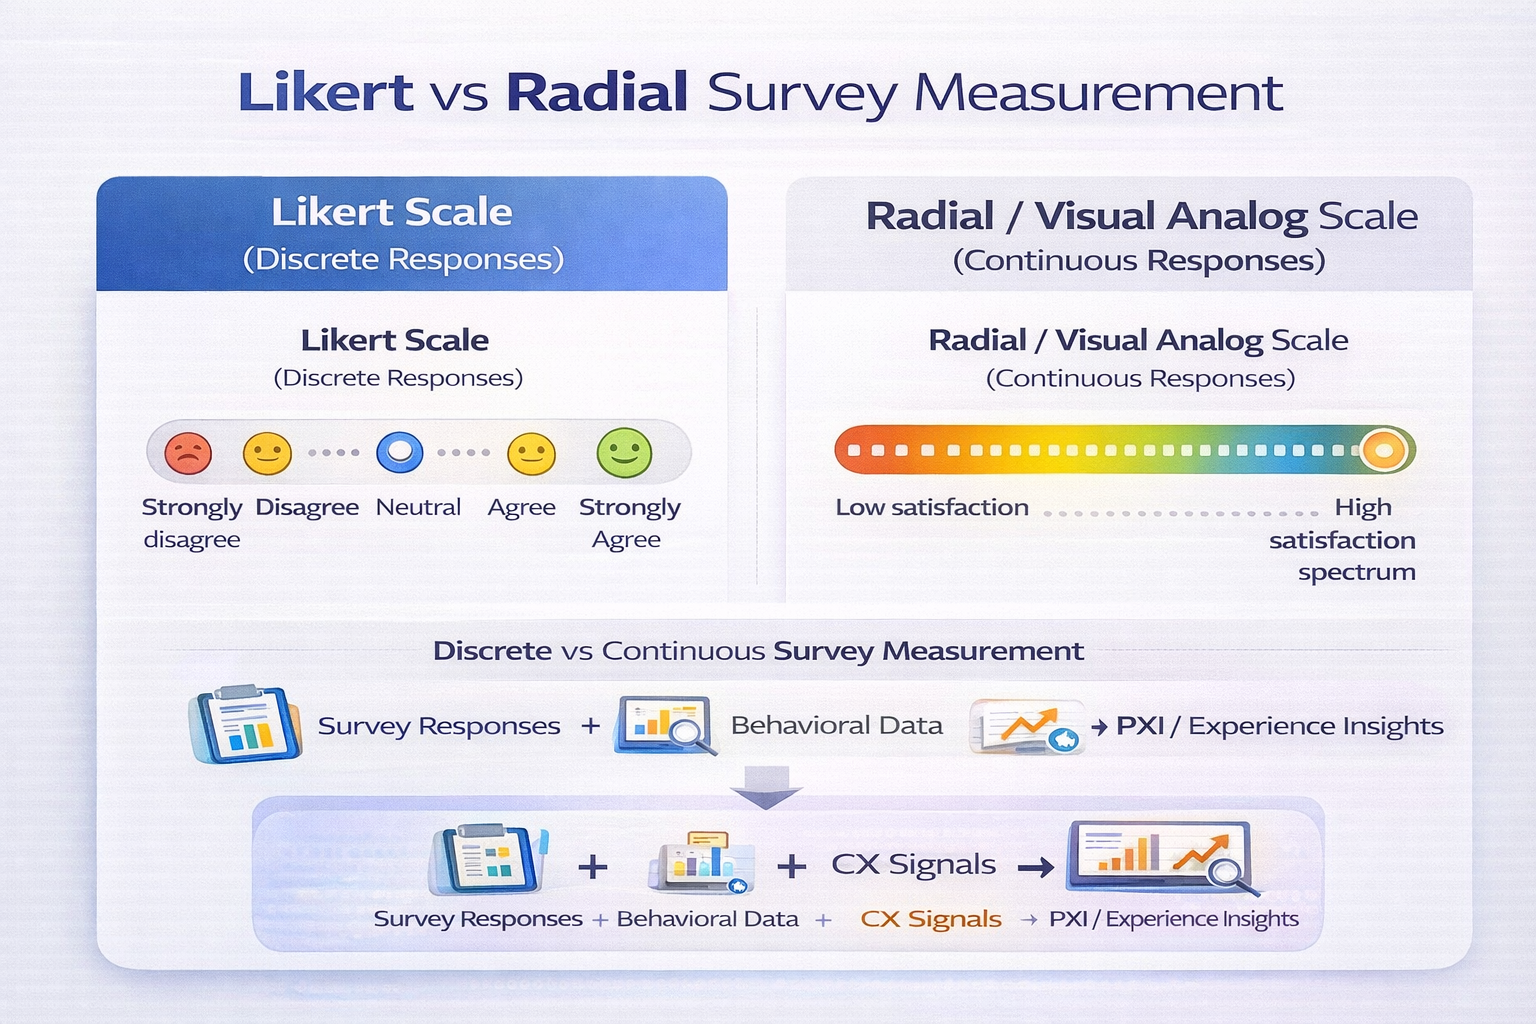
• Radial scales (visual analog scales) capture responses on a continuous spectrum and allow much more granular measurement of sentiment.
• Research shows radial scales may offer higher precision, but they also produce higher missing response rates (~8%) compared with roughly 1% for Likert scales.
• Likert scales typically offer 5–7 discrete response options, while some radial indicators can provide up to 180 response points.
• Choosing the right scale depends on research goals, respondent experience, and how the data will be analyzed.
• For CX teams using experience intelligence and PXI frameworks, selecting the correct survey scale improves the reliability of insights generated from customer feedback.
When you design a survey, the response scale is just as important as the question itself. Even a well-written question can generate misleading insights if the response scale does not capture how respondents truly feel.
In survey research, response scales influence:
Two response scale formats dominate modern research:
Likert scales and radial scales.
A Likert scale survey uses discrete ordinal categories such as:
These scales convert qualitative opinions into numeric survey data that researchers can analyze statistically. By contrast, radial scales or visual analog scales (VAS) allow respondents to select a point along a continuous visual line or circular indicator, capturing much finer levels of sentiment. Because these scales measure responses differently, they produce different types of research data. Likert scales generate ordinal discrete data, while radial scales generate continuous measurement data.
Despite newer measurement approaches, Likert scales remain the most widely used response format in surveys. One major reason is usability. Likert scales are easy for respondents to understand and quick to complete.
Research comparisons show that Likert surveys typically produce much lower missing response rates than visual analog scales around 1% versus approximately 8% for VAS formats. This reliability is why many research experts still consider Likert scales to be highly robust for measuring attitudes.
As survey methodology research notes:
“Likert scales convert qualitative attitudes into numeric survey data and remain robust despite their ordinal structure.”
However, Likert scales do have limitations. Because they use discrete response categories, they may not capture subtle differences in sentiment intensity.
Radial scales and visual analog scales are becoming more common in UX research, product feedback systems, and digital experience measurement. Unlike Likert scales, radial scales measure sentiment along a continuous range. Some radial indicator systems can support up to 180 response positions, offering significantly more measurement granularity than traditional 5–7 point Likert scales. This allows researchers to capture small differences in user sentiment that discrete scales may miss.
Studies comparing Likert and radial approaches suggest that both methods often show similar overall validity, but radial scales can capture more precise intensity levels. Because of this, radial scales are often used in UX usability testing and digital experience measurement environments.
Modern organizations increasingly combine survey feedback with behavioral analytics and customer experience intelligence systems. This means that the precision of survey measurements directly affects CX insights.
If a survey scale cannot capture subtle differences in perception, organizations may miss important signals about:
For teams analyzing customer feedback using modern CX analytics frameworks and operational CXM platforms like those used by Numr, choosing the right survey measurement method becomes critical. The goal is not simply to collect survey responses. The goal is to generate reliable experience insights that help organizations understand customer sentiment, friction, and journey quality more accurately.
Understanding the difference between Likert scales and radial scales is the first step toward designing surveys that deliver those insights.
When researchers design a survey, they often focus primarily on the questions themselves. But in practice, the response scale is just as important as the question. A well-written survey question can still produce misleading insights if respondents do not have the right way to express their opinions.
This is why response scale design plays a critical role in survey research methodology.
In any survey, two elements determine the quality of the insights collected:
If the response scale does not capture the respondent’s true sentiment, the data produced by the survey can become unreliable.
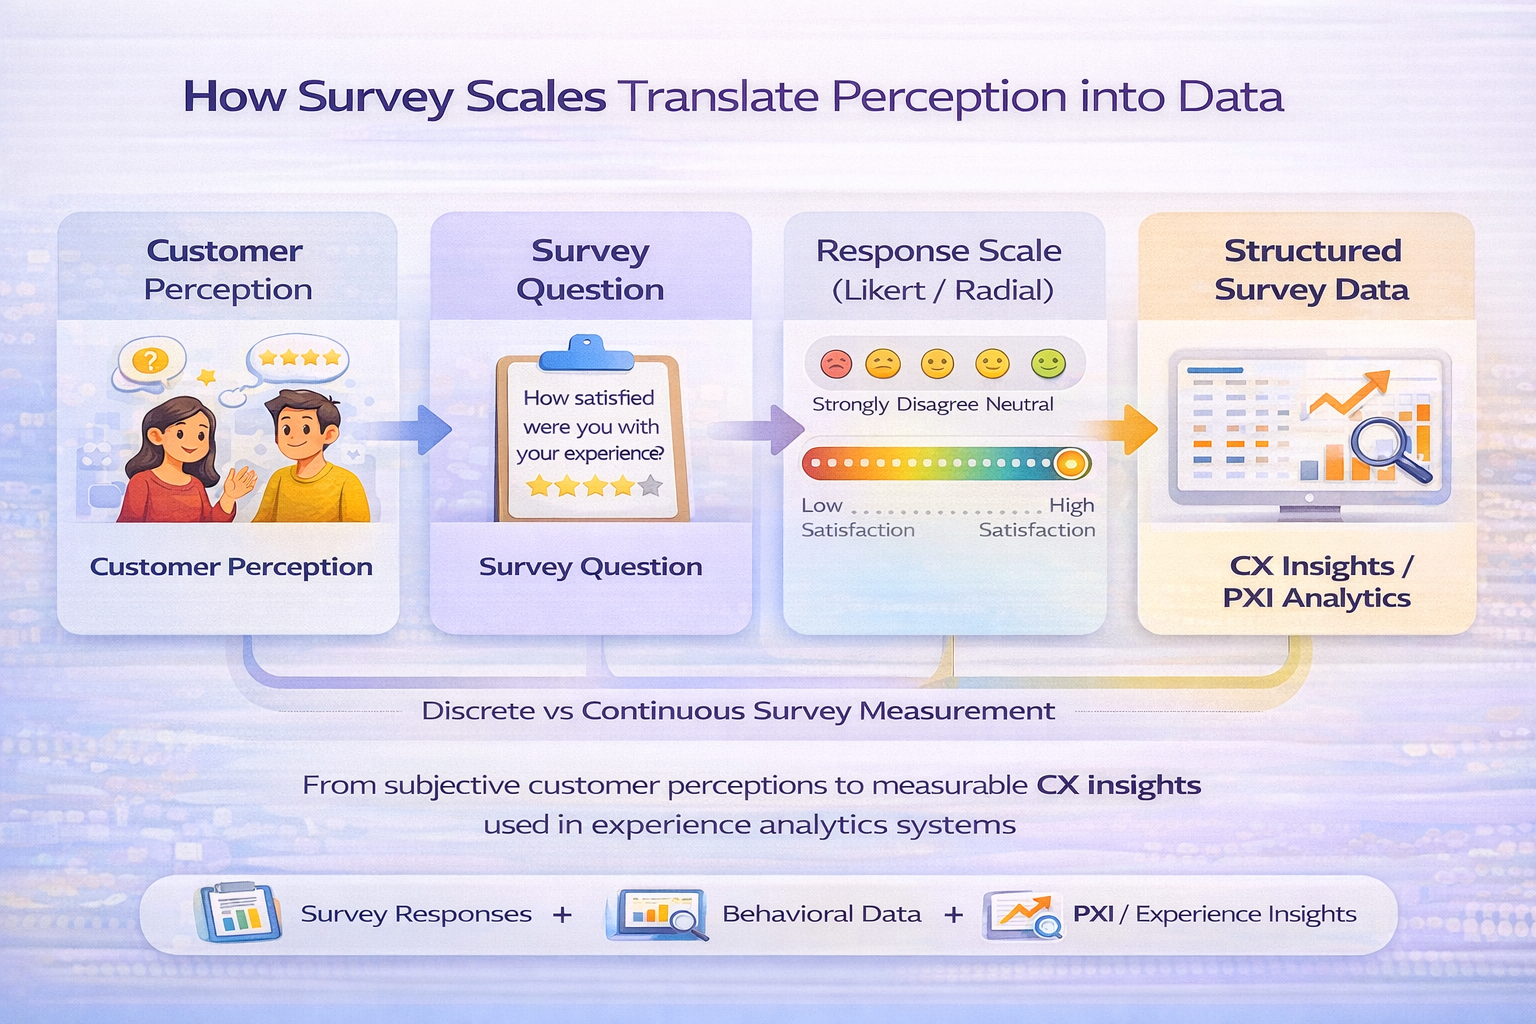
Survey research attempts to measure something that is inherently subjective: human attitudes, opinions, and perceptions. Unlike physical measurements, these experiences cannot be observed directly. Instead, surveys translate perceptions into structured data.
Response scales make this translation possible. For example, a survey asking about customer satisfaction may allow respondents to answer using: Strongly disagree; Disagree; Neutral; Agree; Strongly agree. This format converts qualitative opinions into ordinal data that can be analyzed statistically.
However, this approach introduces an important methodological limitation.Because Likert scales use fixed categories, they sometimes fail to capture subtle differences in how strongly respondents feel about a question.
One of the most important distinctions in survey methodology is the difference between discrete and continuous response scales. Discrete scales divide responses into predefined categories, while continuous scales allow respondents to indicate their position along a spectrum.
Likert scales typically provide five to seven response options, which makes them easy to interpret and analyze. Radial scales and visual analog scales (VAS), by contrast, allow respondents to select any point along a continuous range. Some radial indicator systems can support up to 180 response positions, allowing researchers to measure sentiment with far greater precision than traditional Likert scales.
Although continuous scales offer greater precision, usability is a major factor in survey research. Respondents must be able to understand the scale quickly and answer the question without confusion. Research comparing survey formats shows that visual analog scales often produce higher missing response rates around 8% compared with roughly 1% for Likert scales.
This difference highlights an important trade-off in survey design:
Because of this, many large-scale surveys still rely on Likert scales to maintain higher completion rates.
For organizations analyzing customer feedback, response scale design has a direct impact on the insights generated from survey data.
Customer experience teams increasingly combine survey responses with:
This integrated approach allows organizations to understand not only what customers say in surveys, but also how they behave in real interactions. Platforms built around modern CX analytics and operational experience intelligence such as the frameworks used by Numr help connect survey responses with behavioral signals to uncover deeper patterns in customer perception.
In these environments, the precision and reliability of survey measurement become critical. The response scale chosen for a survey can influence how accurately these experience insights reflect real customer sentiment. Understanding the difference between Likert scales and radial scales is therefore an essential step in designing surveys that generate meaningful CX intelligence.
The Likert scale is one of the most widely used measurement tools in survey research. It was originally designed to measure attitudes and opinions by allowing respondents to indicate their level of agreement with a statement.
A typical Likert scale survey question might look like this:
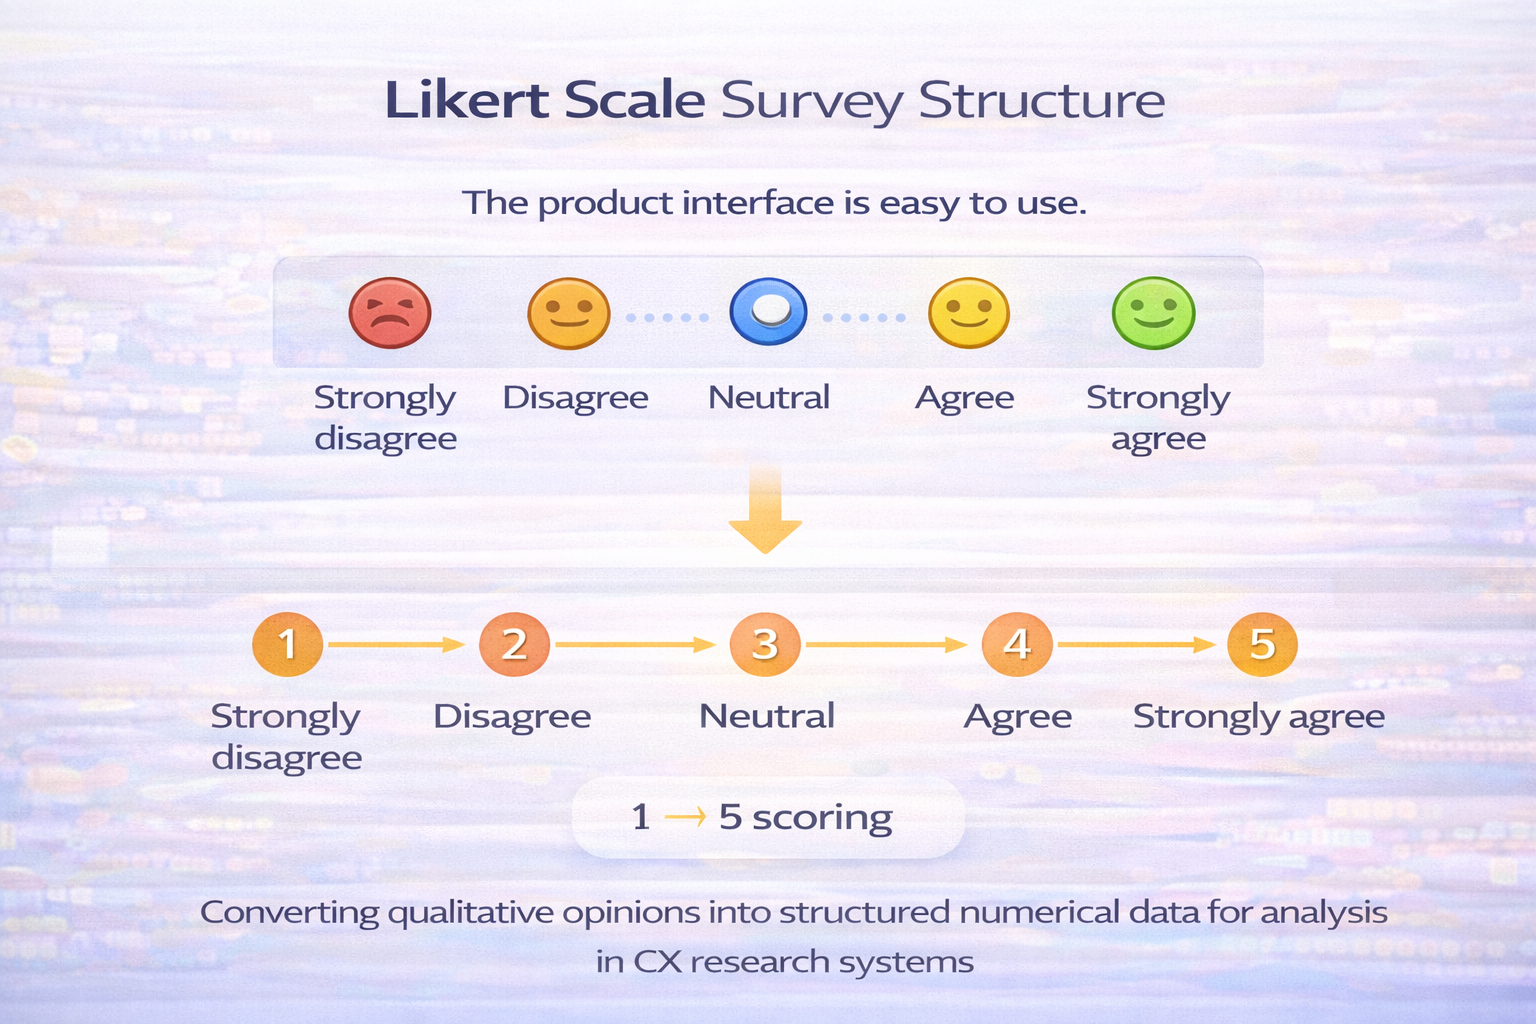
“The product is easy to use.”
Respondents then select a response option such as:
This format transforms qualitative opinions into structured numeric data, allowing researchers to analyze trends across large groups of respondents. Because of its simplicity and reliability, the Likert scale has become the default measurement format in customer experience research, product feedback surveys, and employee engagement studies.
A Likert scale is considered an ordinal measurement scale, meaning responses are ordered but the distance between each option is not necessarily equal.
For example, survey platforms often convert responses into numeric scores:
These numeric values allow researchers to analyze patterns such as:
As survey methodology research explains:
“Likert scales convert qualitative attitudes into numerical survey data using polytomous item scales.”
– Survey measurement methodology reference
This ability to convert perception into measurable data is why Likert scales remain dominant in survey design.
Despite newer measurement approaches, Likert scales remain the most widely used survey response format. There are several reasons for this. First, Likert scales are extremely easy for respondents to understand. People encounter them frequently in surveys, which reduces confusion and improves response rates.
Second, Likert scales are highly reliable across many types of research studies. Research comparing different survey measurement methods consistently finds that Likert scales perform well even when their ordinal structure challenges strict statistical assumptions.
As noted in survey methodology literature:
“Likert scales remain robust for attitude measurement even when interval assumptions are imperfect.”
– Survey research methodology reference
This robustness makes Likert scales a practical choice for many large-scale research programs.
Although Likert scales are widely used, they do have limitations. Because responses are divided into fixed categories, they cannot always capture subtle differences in sentiment intensity.
For example, two respondents might both select “agree,” even though one feels slightly positive while the other feels strongly positive. Continuous measurement methods such as visual analog scales (VAS) or radial scales attempt to address this limitation by allowing respondents to select any point along a spectrum. However, Likert scales still dominate survey research because they balance simplicity, reliability, and usability.
For organizations measuring customer experience, Likert scales provide a reliable way to capture structured feedback.
They are commonly used in surveys that measure:
When survey results are analyzed alongside behavioral data, they can reveal important insights about customer perception.Modern CX analytics and customer experience intelligence platforms such as the frameworks used by Numr often combine Likert survey data with behavioral signals to identify patterns in customer experience.
This integration allows organizations to move beyond simple survey reporting and develop deeper insights into what drives customer satisfaction, engagement, and loyalty.
While Likert scales rely on fixed response categories, radial scales measure responses along a continuous spectrum. Instead of selecting a predefined option such as agree or strongly agree, respondents indicate their position along a visual scale that represents the intensity of their opinion.
Radial scales are often implemented using formats such as:
For example, a survey question might ask:
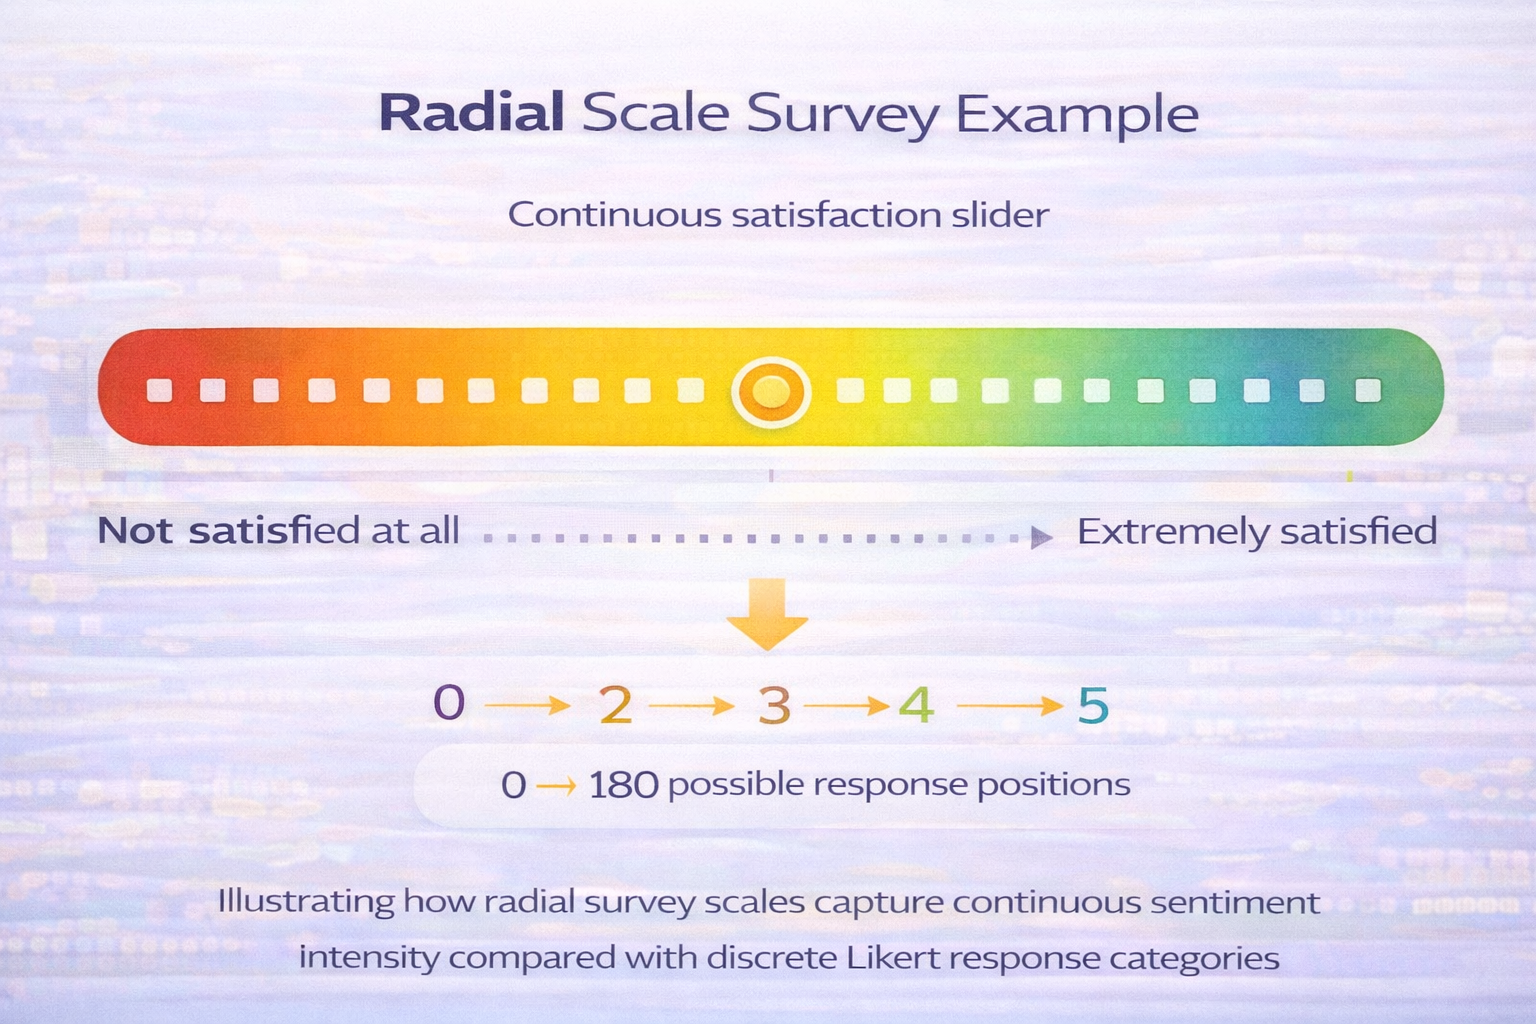
“How satisfied are you with the product experience?”
Instead of choosing from five options, the respondent moves a slider or selects a point along a continuous line ranging from not satisfied at all to extremely satisfied. This approach allows researchers to capture much more granular feedback than traditional discrete survey scales.
Radial scales belong to a category of measurement tools known as continuous response scales. Unlike Likert scales, which divide responses into fixed categories, radial scales allow respondents to choose any point along a continuum. Some radial indicator systems can support up to 180 possible response positions, offering significantly greater measurement precision compared with traditional Likert formats.
This level of granularity makes radial scales particularly useful when researchers want to measure small differences in sentiment intensity.
Survey methodology research highlights this advantage:
“Radial indicators can support up to 180 response options, reducing measurement error compared with discrete scales.”
– Sama Radial Indicator research
Because of this, radial scales are often used in environments where precision is critical.
Radial scales provide several methodological advantages in survey design.
Because responses are continuous rather than discrete, radial scales can capture subtle differences in sentiment that Likert scales may miss.
For example, two respondents who both feel “somewhat satisfied” might select slightly different positions on a radial scale, allowing researchers to detect nuanced differences in perception.
Radial scales are particularly useful for measuring intensity-based experiences, such as:
As UX research literature explains:
“Visual analog scales measure intensity by allowing respondents to mark a position along a continuous line.”
– Interaction Design Foundation research
This ability to measure intensity makes radial scales valuable in usability testing and digital experience research.
Despite their precision advantages, radial scales introduce usability challenges.
Respondents may find continuous scales slightly harder to interpret than discrete response categories.
Survey comparisons show that visual analog scales tend to produce higher missing response rates, approximately 8% compared with about 1% for Likert scales.
This difference highlights a key trade-off in survey design:
Because of this, researchers must carefully consider the context in which the survey will be used.
Radial scales are becoming increasingly popular in digital experience measurement and UX research.
They are often used in:
Modern CX research platforms increasingly combine radial survey data with behavioral analytics to generate deeper insights about user behavior.
Frameworks built around modern CX analytics such as the approaches used by Numr help organizations connect continuous survey responses with behavioral signals to understand customer sentiment at a deeper level.
This integration allows research teams to move beyond simple satisfaction scores and begin analyzing experience intensity and behavioral impact.
Both Likert scales and radial scales are widely used in survey research, but they measure responses in fundamentally different ways. Understanding these differences is important when designing surveys that aim to capture accurate insights about customer experience, product perception, or user sentiment.
At the most basic level, the distinction between the two scales comes down to discrete versus continuous measurement. A Likert scale divides responses into fixed categories, while a radial scale allows respondents to choose a position along a continuous spectrum. Because of this difference, the two scales produce different types of survey data and different levels of measurement precision.
The following table highlights the core differences between these two measurement methods.
Likert scales prioritize simplicity and respondent familiarity, which is why they remain the most common response format in surveys. Radial scales prioritize measurement precision, allowing researchers to capture more granular sentiment data.
The difference between Likert and radial scales also reflects a broader concept in survey methodology: discrete versus continuous measurement. Discrete measurement tools divide responses into predefined steps. Continuous measurement tools allow respondents to indicate their sentiment anywhere along a scale.
For example:
A Likert question might ask:
“How satisfied are you with the product?”
Response options:
A radial scale might ask the same question but allow respondents to place a marker anywhere along a satisfaction spectrum. Because the response is continuous, researchers can detect subtle differences in sentiment intensity. Some radial indicator systems can support up to 180 response positions, offering significantly greater measurement granularity compared with typical Likert scales.
The key trade-off between these two approaches is usability versus measurement precision. Likert scales are easy to understand and quick to complete, which makes them highly effective for large-scale surveys. Radial scales provide greater precision but require slightly more cognitive effort from respondents.
Because of this, the choice between Likert and radial scales often depends on the research objective. If the goal is to measure general attitudes across a large population, Likert scales are usually the better option. If the goal is to capture subtle variations in sentiment particularly in UX testing or product experience measurement, radial scales may provide more useful insights.
For organizations analyzing customer feedback, the survey response scale directly influences the insights generated from the data. Customer experience teams increasingly combine survey responses with behavioral analytics to understand how perception influences behavior.
Modern CX analytics and operational experience intelligence platforms including the frameworks used by Numr integrate survey measurement with customer journey data to uncover deeper patterns in user sentiment.
In these environments, the precision of survey measurement becomes critical. Choosing the correct response scale helps ensure that survey insights accurately reflect the customer experience.
Choosing the right response scale in survey design depends largely on the research objective and the type of insight you want to measure. In many situations, the Likert scale remains the most practical and reliable survey measurement method.
Because it uses discrete response categories, a Likert scale allows respondents to quickly interpret questions and provide structured feedback. This simplicity makes Likert scales particularly effective for large-scale surveys where response rate and usability are critical factors.
Research comparing response scale formats shows that Likert-based surveys generally produce much lower missing response rates around 1% compared with roughly 8% for visual analog scales. This reliability is one reason Likert scales continue to dominate survey research across many industries.
Likert scales work best when researchers want to measure attitudes, perceptions, or agreement levels. They are widely used in surveys that focus on understanding how people feel about a product, service, or experience.
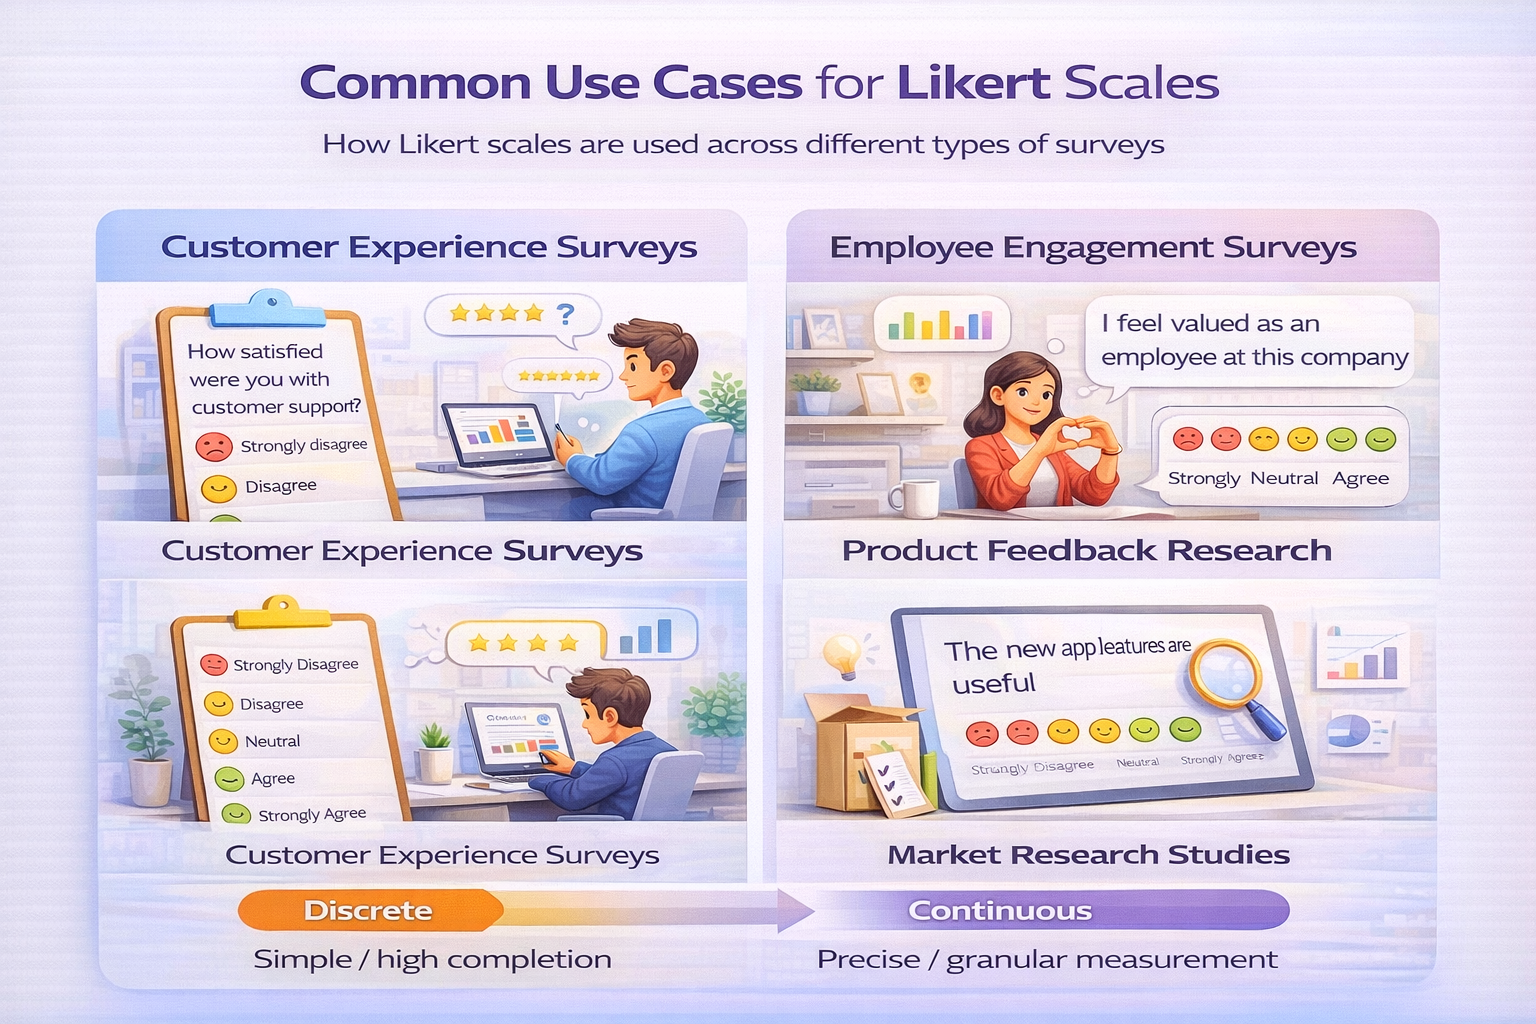
Common use cases include:
Likert scales are frequently used in customer satisfaction and customer experience surveys.
They allow organizations to measure perceptions such as:
Because responses are standardized, CX teams can easily track satisfaction trends over time.
Employee engagement studies often rely heavily on Likert-scale questions.
For example:
“I feel recognized for my contributions at work.”
Employees respond using a scale such as:
These responses help HR teams quantify engagement levels and identify areas that require improvement.
Product teams frequently use Likert scales to evaluate usability and product perception.
Example survey question:
“The product interface is easy to navigate.”
This approach allows researchers to measure how users perceive specific product features.
In market research, Likert scales help measure:
Because Likert scales generate structured numeric data, researchers can easily analyze trends across large respondent groups.
Another reason Likert scales remain dominant is their ease of interpretation. Respondents encounter Likert questions frequently, which reduces cognitive effort when answering surveys.
This familiarity helps maintain higher completion rates. Research also shows that Likert scales remain highly reliable for measuring attitudes, especially when multiple related questions are combined into a multi-item scale. Because of this reliability, Likert scales are widely used in customer experience research, product feedback systems, and digital experience measurement programs.
Today, many organizations combine survey insights with behavioral analytics to understand how customer perceptions influence real-world behavior.
Survey responses collected using Likert scales are often analyzed alongside:
Modern CX intelligence and customer experience analytics platforms including the frameworks used by Numr integrate Likert survey responses with behavioral signals to uncover patterns in customer perception and product experience.
This integration allows organizations to move beyond simple satisfaction scores and develop deeper insights into what drives engagement and loyalty.
Radial scales become valuable when your research objective is to understand fine variations in customer perception across digital experiences. In advanced CX research environments, small differences in sentiment can reveal meaningful changes in customer behavior and experience quality.
Unlike Likert scales, which divide responses into fixed categories, radial scales allow respondents to select a point along a continuous spectrum, capturing a more precise representation of how they feel about an interaction or experience.
Because radial measurement is continuous rather than discrete, it can reveal nuanced differences in perception that fixed response options may mask. Some radial indicator designs support up to 180 response positions, offering much greater granularity than traditional 5–7 point Likert scales.
However, this increased precision also introduces a usability trade-off. Research comparing survey formats shows that visual analog or radial scales may produce higher missing responses around 8% compared with roughly 1% for Likert scales. For this reason, radial scales are typically used in situations where the depth of measurement is more important than maximizing response simplicity.
In CX research programs, radial scales are particularly useful when organizations want to measure experience intensity rather than simple agreement. They allow respondents to express how strongly they feel about a specific interaction, product touchpoint, or digital journey moment.
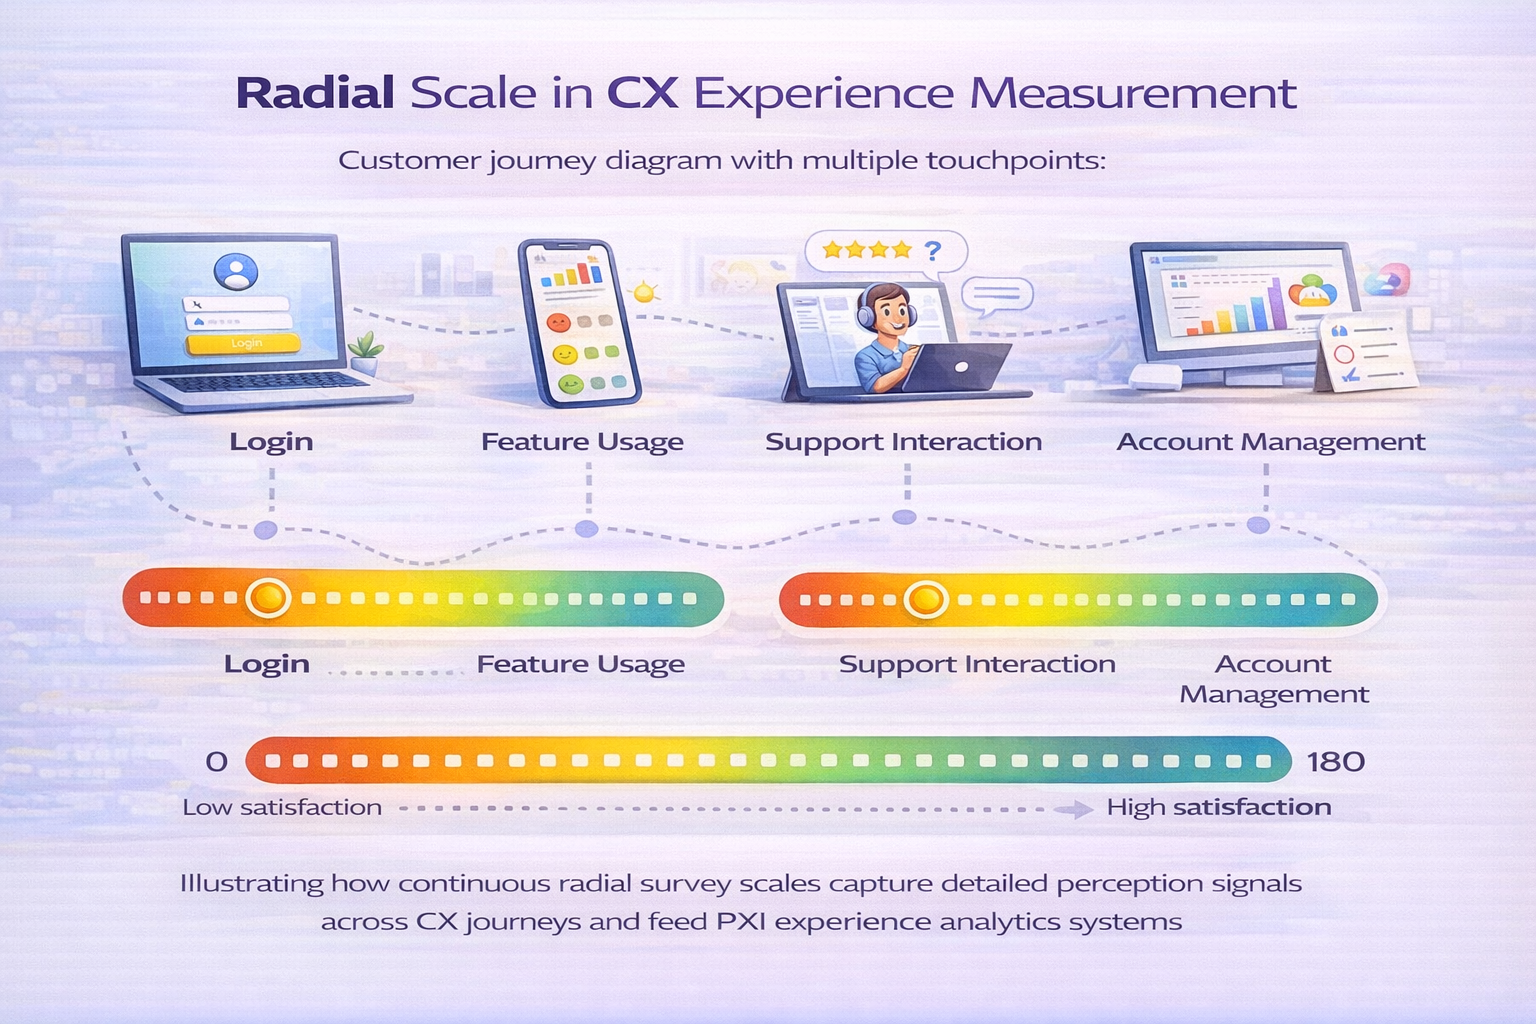
For example, radial measurement can help CX teams understand subtle differences in customer perception across areas such as:
Because these experiences often involve multiple emotional or cognitive signals, a continuous response scale provides richer feedback than discrete categories.
When survey data is combined with behavioral analytics, these nuanced signals become even more valuable. Continuous response measurements allow CX analytics systems to detect patterns between perceived experience quality and actual customer behavior.
In industries such as retail banking and financial services, CX teams often analyze how customers interact with digital products like mobile banking platforms, payment journeys, or account management dashboards. Radial scales can help capture the intensity of customer perception across these digital experiences, identifying moments where satisfaction begins to decline or friction increases.
For example, a customer might rate their satisfaction with a mobile banking feature somewhere between moderately satisfied and highly satisfied. A continuous radial scale captures that precise sentiment rather than forcing the respondent into a predefined category.
When combined with behavioral signals such as login frequency, feature usage, or journey abandonment, these insights help CX teams understand why customers behave the way they do across digital banking journeys.
Modern experience analytics frameworks increasingly connect survey responses with behavioral and journey analytics. In these environments, the precision of survey measurement becomes critical.
Radial scales provide a way to capture continuous perception data, which can then be integrated with CX analytics systems to analyze how experience intensity influences engagement, retention, or product adoption.
Platforms designed for CX intelligence and experience analytics such as the frameworks used by Numr combine survey measurements with behavioral data to identify patterns across the customer journey. Continuous response scales can enhance this analysis by providing more detailed signals about how customers perceive specific interactions.
Rather than simply reporting satisfaction scores, these systems use survey insights to uncover experience drivers that influence customer behavior.
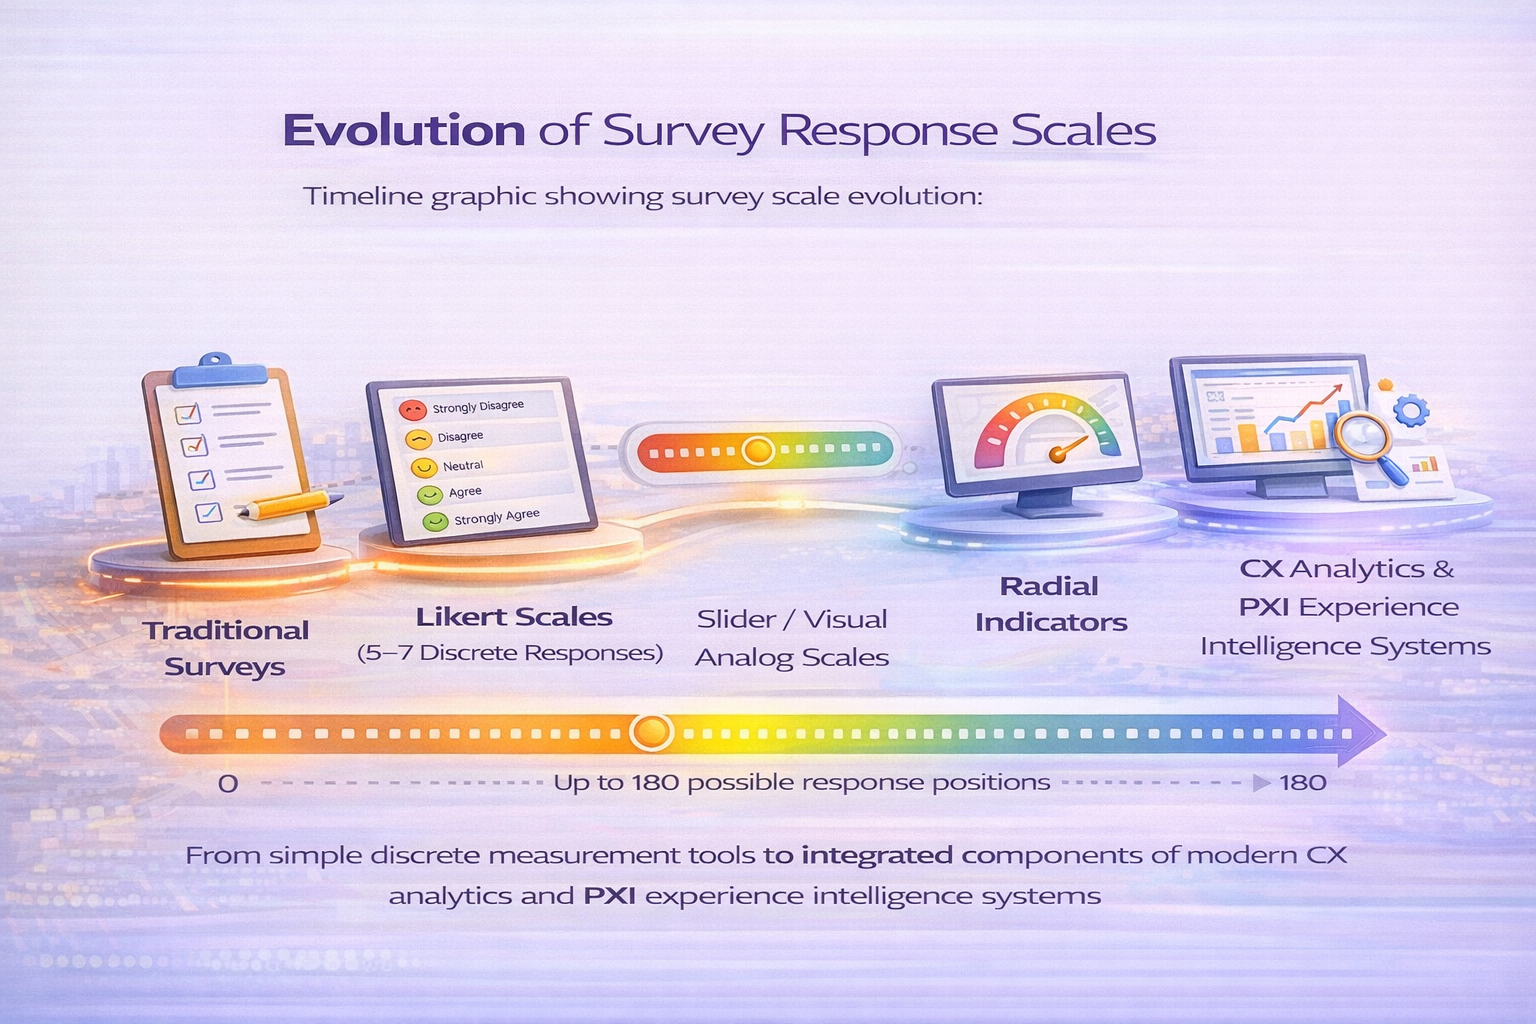
Survey response scales are evolving as digital research tools become more sophisticated and customer experience analytics becomes more data-driven. While traditional Likert scale survey research still dominates many feedback programs, new scale formats are increasingly used to capture richer experience signals across digital journeys.
Modern survey environments now support a variety of response formats, including:
These formats are often used in digital experience measurement because they allow researchers to collect feedback in a way that feels more natural within an online interface.
At the same time, research shows that Likert scales continue to remain the most widely used survey measurement method due to their familiarity and reliability. Likert responses convert qualitative attitudes into structured numerical values that can be easily analyzed in large research datasets.
However, emerging response formats are gaining attention because they offer greater measurement granularity. Continuous scales such as radial indicators or visual analog scales allow respondents to express their sentiment anywhere along a spectrum rather than choosing a fixed category. Some radial indicator systems can support up to 180 response positions, allowing much finer measurement of perception intensity than traditional discrete scales.
This increased precision is particularly valuable in CX analytics environments where small changes in customer perception may signal meaningful shifts in engagement or satisfaction.
Another important trend shaping survey methodology is the growing integration of survey feedback with behavioral analytics and experience intelligence systems.
Traditional surveys focused primarily on collecting feedback. Today, many organizations combine survey responses with:
This integrated approach allows CX teams to understand not only what customers say in surveys, but also how they behave across digital experiences. As a result, survey response scales are increasingly selected based on how well they support experience analytics models.
Discrete scales like Likert formats are often preferred when surveys must reach large audiences quickly. Continuous scales like radial indicators are more useful when the goal is to capture subtle differences in perception intensity.
Modern CX analytics frameworks increasingly rely on survey measurement to interpret behavioral data. Response scales are no longer simply tools for collecting feedback; they are becoming part of a broader customer intelligence ecosystem.
In advanced CX research environments, survey responses help contextualize behavioral signals and explain why customers behave the way they do.
Platforms designed around customer experience intelligence and operational analytics such as the research frameworks used by Numr connect survey feedback with behavioral journey data to generate deeper insights into customer perception.
Because these systems analyze perception and behavior together, the design of survey response scales directly influences the quality of insights generated.
Designing effective surveys is not just about asking the right questions. It also requires choosing the right measurement scale to capture customer perception accurately.
Whether you use a Likert scale or a radial scale, the goal is the same: to translate customer feedback into reliable insights that help improve experiences.
For CX teams, survey responses become significantly more powerful when they are analyzed alongside behavioral data. When perception signals from surveys are combined with journey analytics and product usage data, organizations gain a much clearer understanding of why customers behave the way they do.
Modern CX analytics frameworks increasingly connect survey measurement with behavioral analytics to uncover patterns across digital customer journeys.
Platforms designed for experience intelligence such as the analytics frameworks developed by Numr help organizations transform survey feedback into actionable insights by combining survey responses with behavioral analytics and journey signals.
If your team wants to design surveys that generate deeper CX insights and more reliable research outcomes, exploring modern experience analytics platforms is a valuable next step.
A Likert scale is a survey response format used to measure attitudes or opinions using ordered response categories. Respondents typically select options such as strongly disagree, disagree, neutral, agree, or strongly agree, allowing qualitative opinions to be converted into numerical data for analysis.
A radial scale is a continuous survey response format that allows respondents to select a point along a visual spectrum rather than choosing from predefined categories. Radial scales are often implemented using visual analog scales or slider-based indicators, which capture more granular sentiment measurements.
Discrete survey scales, such as Likert scales, divide responses into fixed categories. Continuous scales, such as radial or visual analog scales, allow respondents to indicate their position anywhere along a spectrum. Continuous scales provide greater measurement precision but may require more effort from respondents.
Radial scales can capture more precise variations in sentiment because they measure responses along a continuous spectrum. However, Likert scales often achieve higher response completion rates and remain more practical for large surveys. The choice depends on the research objective and the level of measurement precision required.
CX teams typically choose the response scale based on the type of insights they want to collect. Likert scales are useful for large-scale satisfaction and perception surveys because they are easy to complete and analyze. Radial scales are more useful when teams need to measure subtle variations in customer experience intensity or emotional perception across journeys.
The right choice depends on whether the goal is simplicity and response volume or deeper measurement precision.
.png)
.svg)


