.png)
What if the way you design a survey scale changes the accuracy of your CX insights? For many customer experience teams, surveys are the foundation of how they measure sentiment, trust, and perceived value. But one small design choice often goes overlooked: how many response options your Likert scale should include.
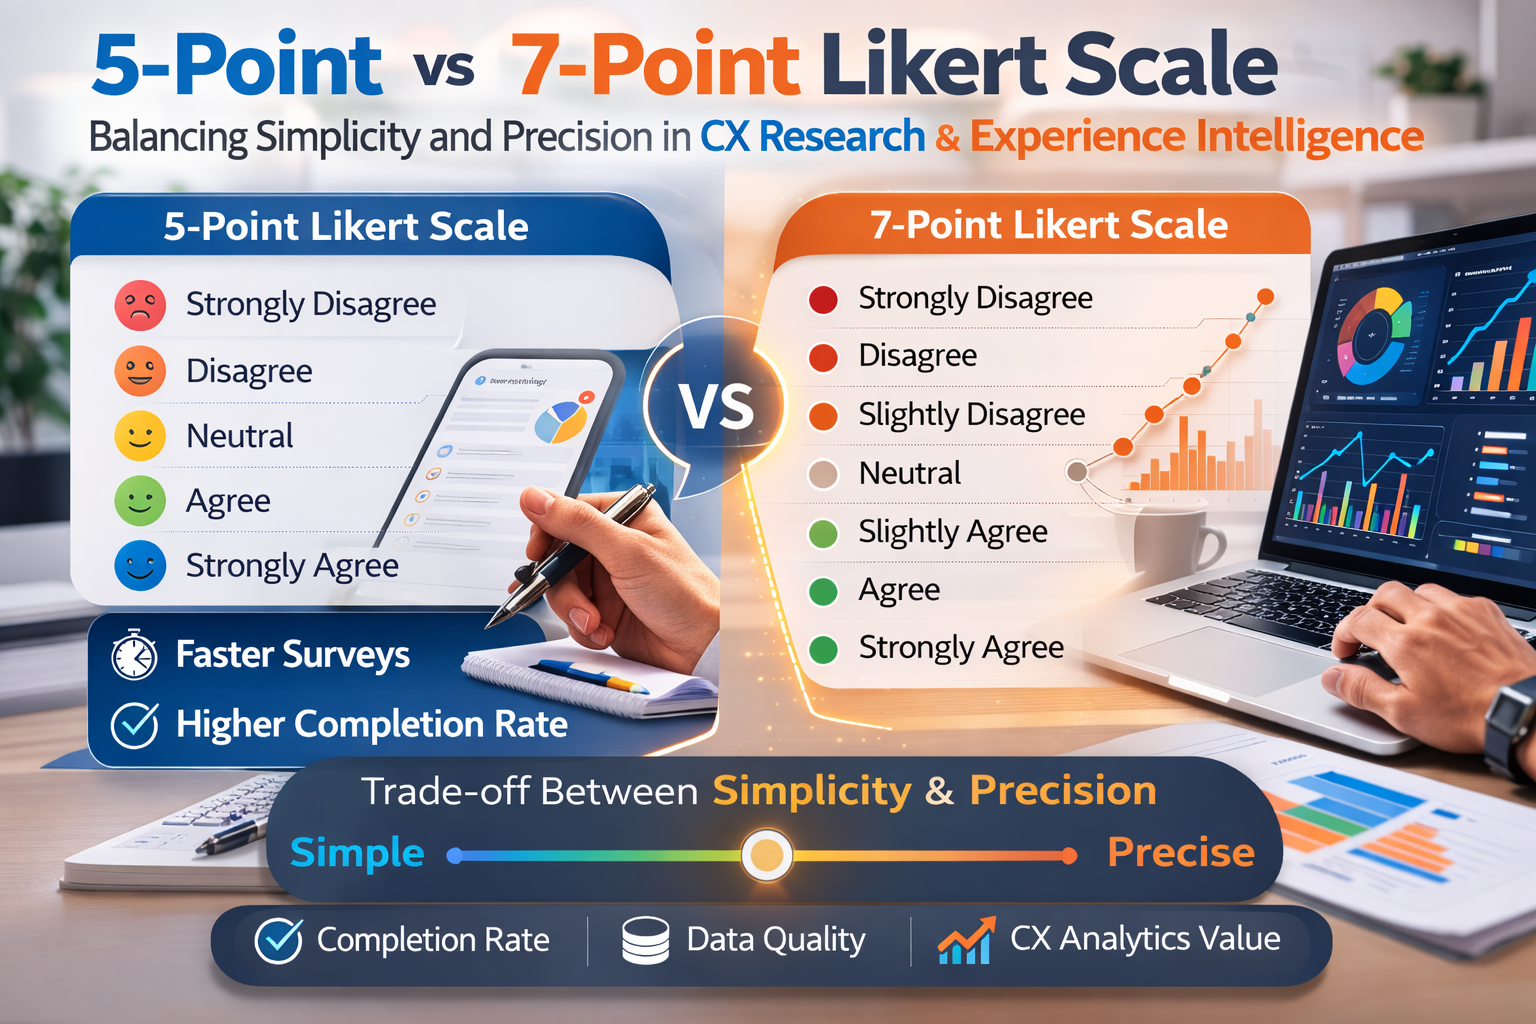
The debate between a 5-point vs 7-point Likert scale may seem like a minor methodological detail. In reality, it directly influences response behavior, data reliability, and the analytical value of CX insights.
However, 7-point scales improve reliability to about 0.85 Cronbach’s alpha compared with roughly 0.78 for 5-point scales, increasing measurement precision by roughly 9–15%. This additional precision can produce 23% higher response variance, which strengthens analytical sensitivity when survey data feeds into advanced CX analytics and customer intelligence systems.
But there is also a trade-off. 7-point scales increase cognitive load and survey effort, raising abandonment rates to about 79% completion and increasing response time by roughly 43% per question.
As survey methodology research summarizes:
“Seven-point scales provide about 15% higher reliability but increase abandonment compared with five-point scales.”
– LikertAI Meta Analysis
For CX leaders, this trade-off matters more than ever. Modern organizations increasingly combine survey responses with CX dashboards, journey analytics systems, behavioral analytics, and operational data layers. In these environments, survey responses are no longer just feedback; they become structured customer signals that help organizations understand sentiment, friction, and experience quality across journeys.
This is why selecting the right Likert scale is not simply a survey design decision. It is a customer intelligence and analytics decision.
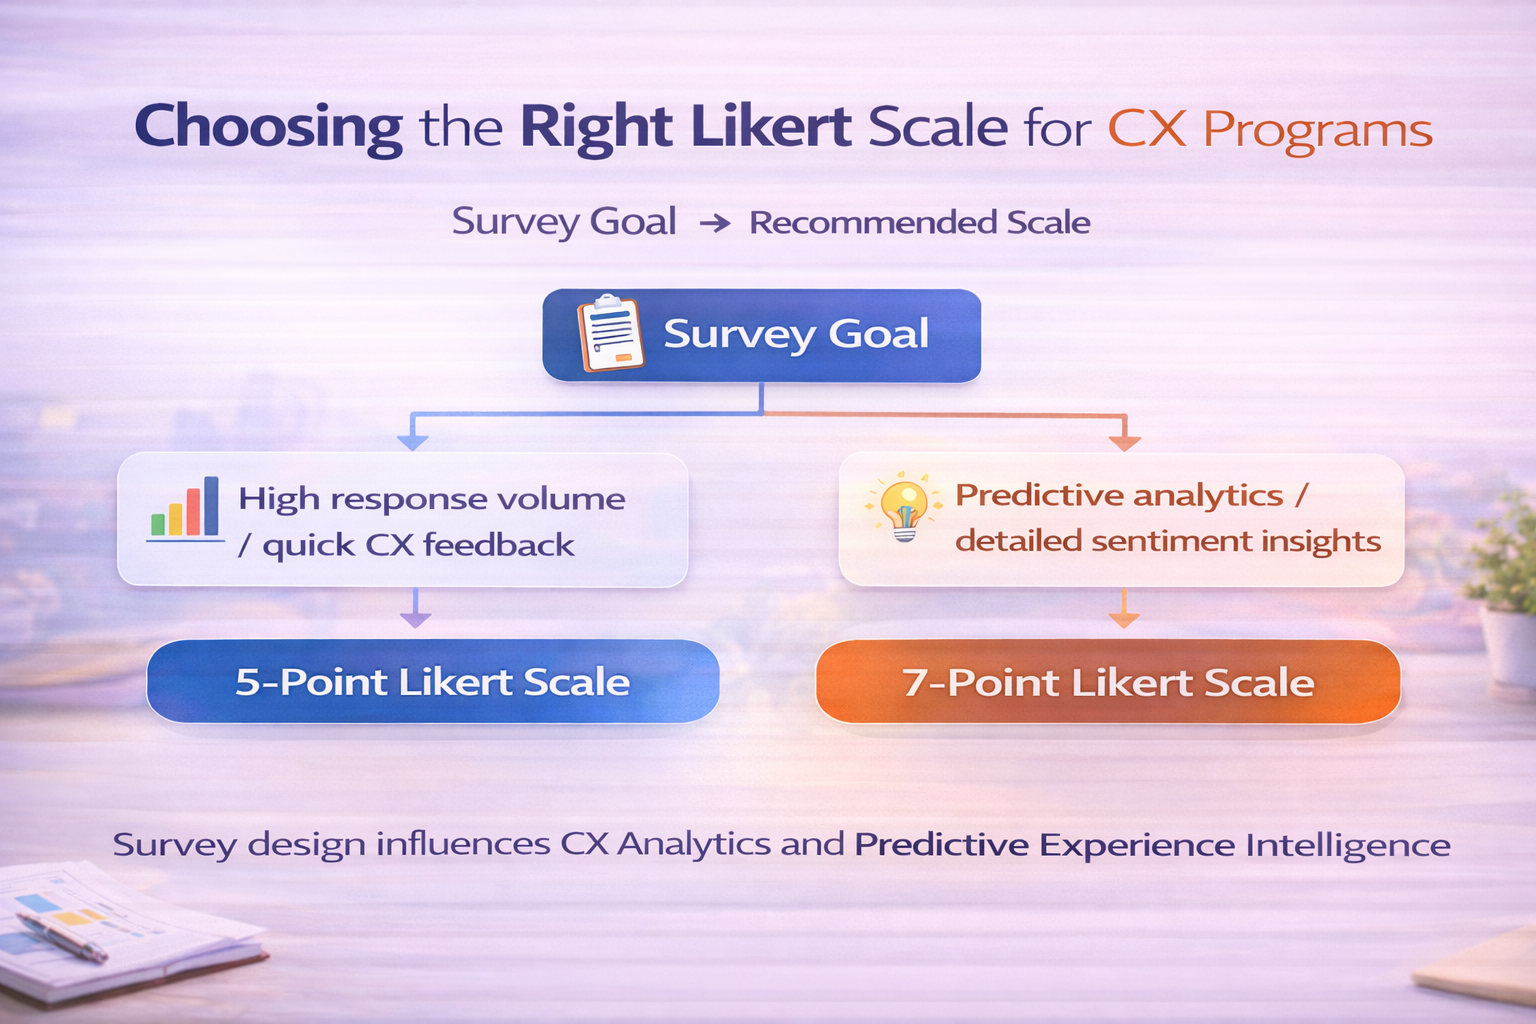
For organizations analyzing experience signals using modern CX analytics platforms and operational CXM systems, the choice between a 5-point vs 7-point Likert scale determines whether the survey prioritizes speed and completion rates or deeper analytical insight. Understanding that trade-off is the first step in designing surveys that generate reliable CX intelligence.
In most customer experience programs, surveys are one of the primary ways organizations understand how customers perceive their products, services, and digital journeys. A well-designed survey can reveal signals about satisfaction, trust, usability, or perceived value. But the usefulness of those signals depends heavily on how responses are measured.
Likert scales play a central role in this process. They convert subjective feedback into structured numerical data that CX teams can analyze across large customer populations. In modern CX programs, those survey signals do not exist in isolation. They are often integrated with behavioral analytics, operational metrics, and journey data to provide a more complete picture of customer experience.
This integration is particularly important in modern CX analytics environments where survey feedback is analyzed alongside behavioral and operational data. Modern CX analytics systems analyze multiple types of customer signals from survey responses to product usage patterns to identify trends in customer experience, engagement, and satisfaction.
In these systems, even small differences in survey measurement granularity can influence how analytics systems interpret sentiment and experience patterns. One key decision that affects these signals is the choice between a 5-point vs 7-point Likert scale.
Greater precision and stronger analytical variance
Research benchmarks highlight the trade-off between these approaches. Five-point Likert surveys typically achieve about 87% completion rates, making them efficient for large-scale feedback programs.
Seven-point scales, however, improve measurement reliability, with Cronbach’s alpha increasing from roughly 0.78 to about 0.85, representing approximately a 9% improvement in reliability.
Seven-point scales also generate about 23% more response variance, which can enhance the sensitivity of CX analytics models and improve the detection of subtle shifts in customer sentiment.
However, this added precision introduces a cost. Surveys using seven response options typically require 43% more response time per question, increasing the likelihood of survey fatigue and abandonment.
For CX leaders, this means that Likert scale design directly affects the quality of the data feeding analytics systems. A simpler scale may produce higher response volume, while a more granular scale may produce richer analytical signals.
In advanced CX analytics programs, the goal is not simply to collect more survey responses. The goal is to collect high-quality experience signals that improve operational visibility, journey understanding, and customer experience analysis across touchpoints.
Choosing the right Likert scale is therefore a strategic design decision that influences how effectively survey feedback contributes to CX intelligence and advanced analytics.

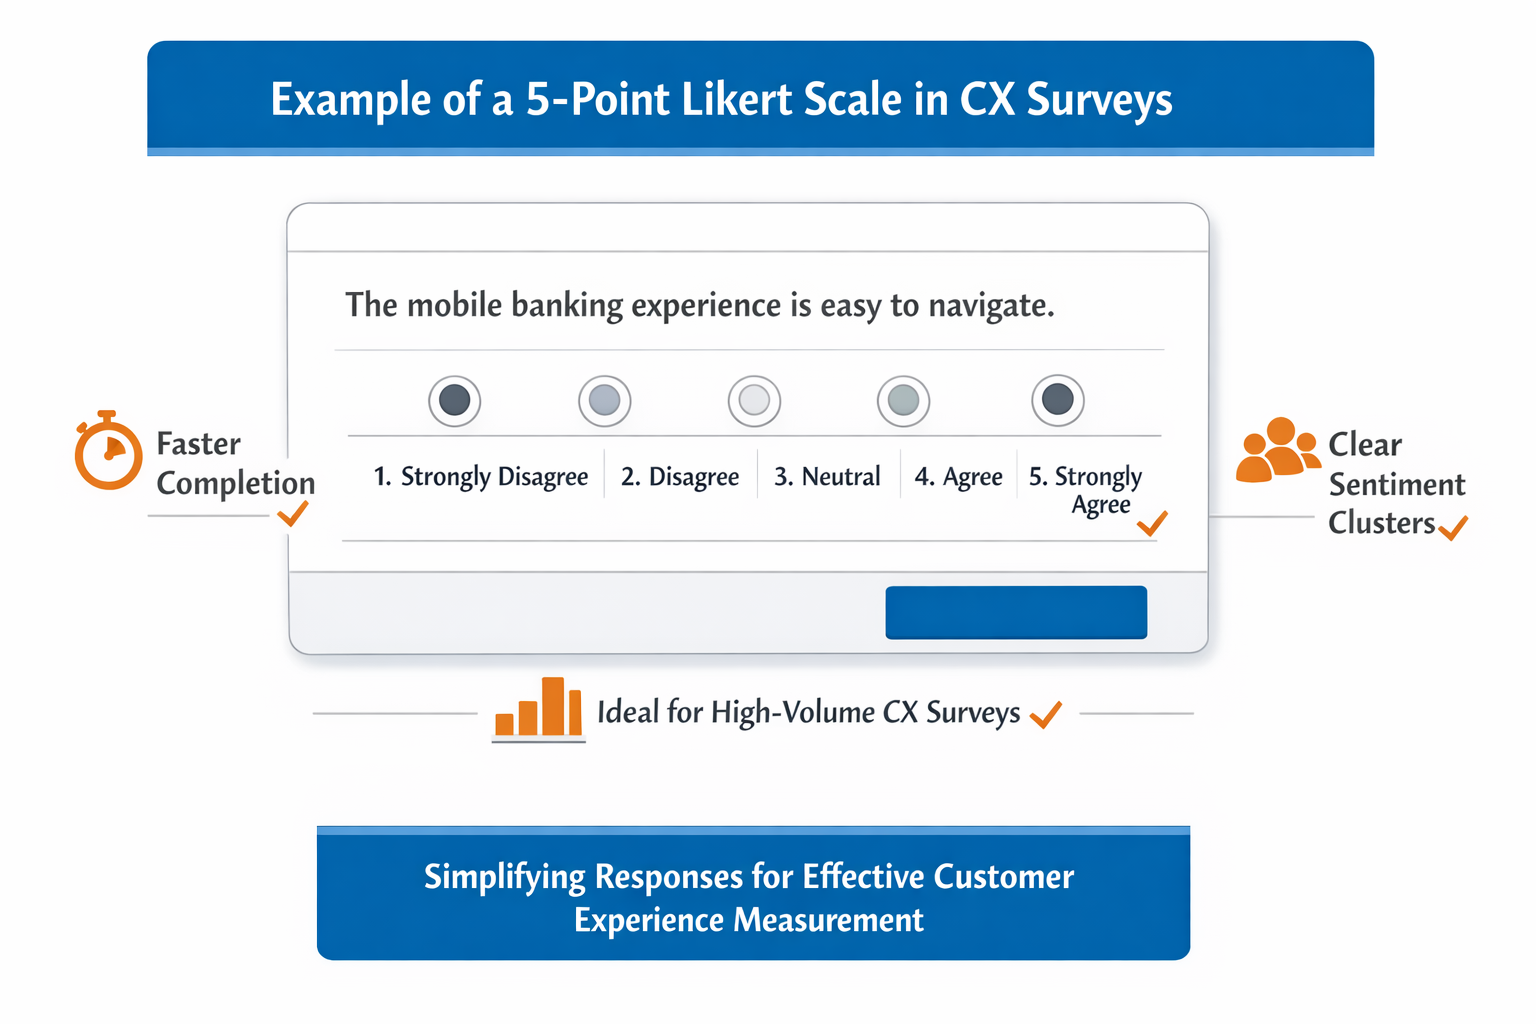
When you design a CX survey, one of the first decisions you make is how simple you want the response process to be for your customers. In many cases, the 5-point Likert scale becomes the default choice because it balances clarity, speed, and usability.
A typical 5-point Likert scale survey looks like this:
Example
Statement: “The digital banking experience is easy to use.”
Response options:
When your customers see this type of scale, they immediately understand how to respond. They don’t have to think too much about subtle differences between options. That simplicity is exactly why many CX teams prefer the 5-point format. In fact, research shows that 5-point Likert surveys achieve completion rates of around 87%, making them one of the most effective formats for collecting large volumes of customer feedback.
For CX leaders, that completion rate matters a lot. The more responses you receive, the more reliable your overall experience insights become.
When we design surveys for customer experience programs, the 5-point scale often works well because it:
1. Reduces cognitive effort for respondents
Your customers don’t need to analyze small differences between response options. They can quickly decide whether they agree, disagree, or feel neutral.
2. Increases response rates
Shorter, simpler scales mean customers are more likely to complete surveys especially in high-volume CX programs such as post-transaction or onboarding feedback.
3. Makes CX dashboards easier to interpret
For CX teams reviewing thousands of responses, the 5-point scale produces clear sentiment clusters that are easier to visualize in dashboards and reports.
Because of these benefits, you will often see the 5-point Likert scale used across many CX measurement programs, including:
In these scenarios, the goal is often to capture broad sentiment trends rather than extremely fine opinion differences.
However, the simplicity of the 5-point scale also introduces a limitation. Sometimes your customers may feel that their experience falls between two response options. For example, they might feel slightly satisfied but not fully satisfied. With only five choices, it becomes harder to capture that nuance. This can lead to response clustering, where many respondents choose the same middle options.
As CX analytics research highlights:
“Five-point scales improve response speed and completion rates but may reduce measurement sensitivity compared with seven-point scales.”
– LikertAI Survey Research Review
For organizations relying heavily on advanced CX analytics and journey analysis, that reduction in measurement sensitivity can sometimes limit how much detail analytics systems can extract from survey responses. This is why CX teams often ask an important follow-up question: Is the higher response rate of the 5-point scale more valuable, or do you need the deeper analytical precision offered by a 7-point scale?
Answering that question depends on how your survey data will be used, particularly when it supports customer experience measurement, journey analytics, and operational decision-making.
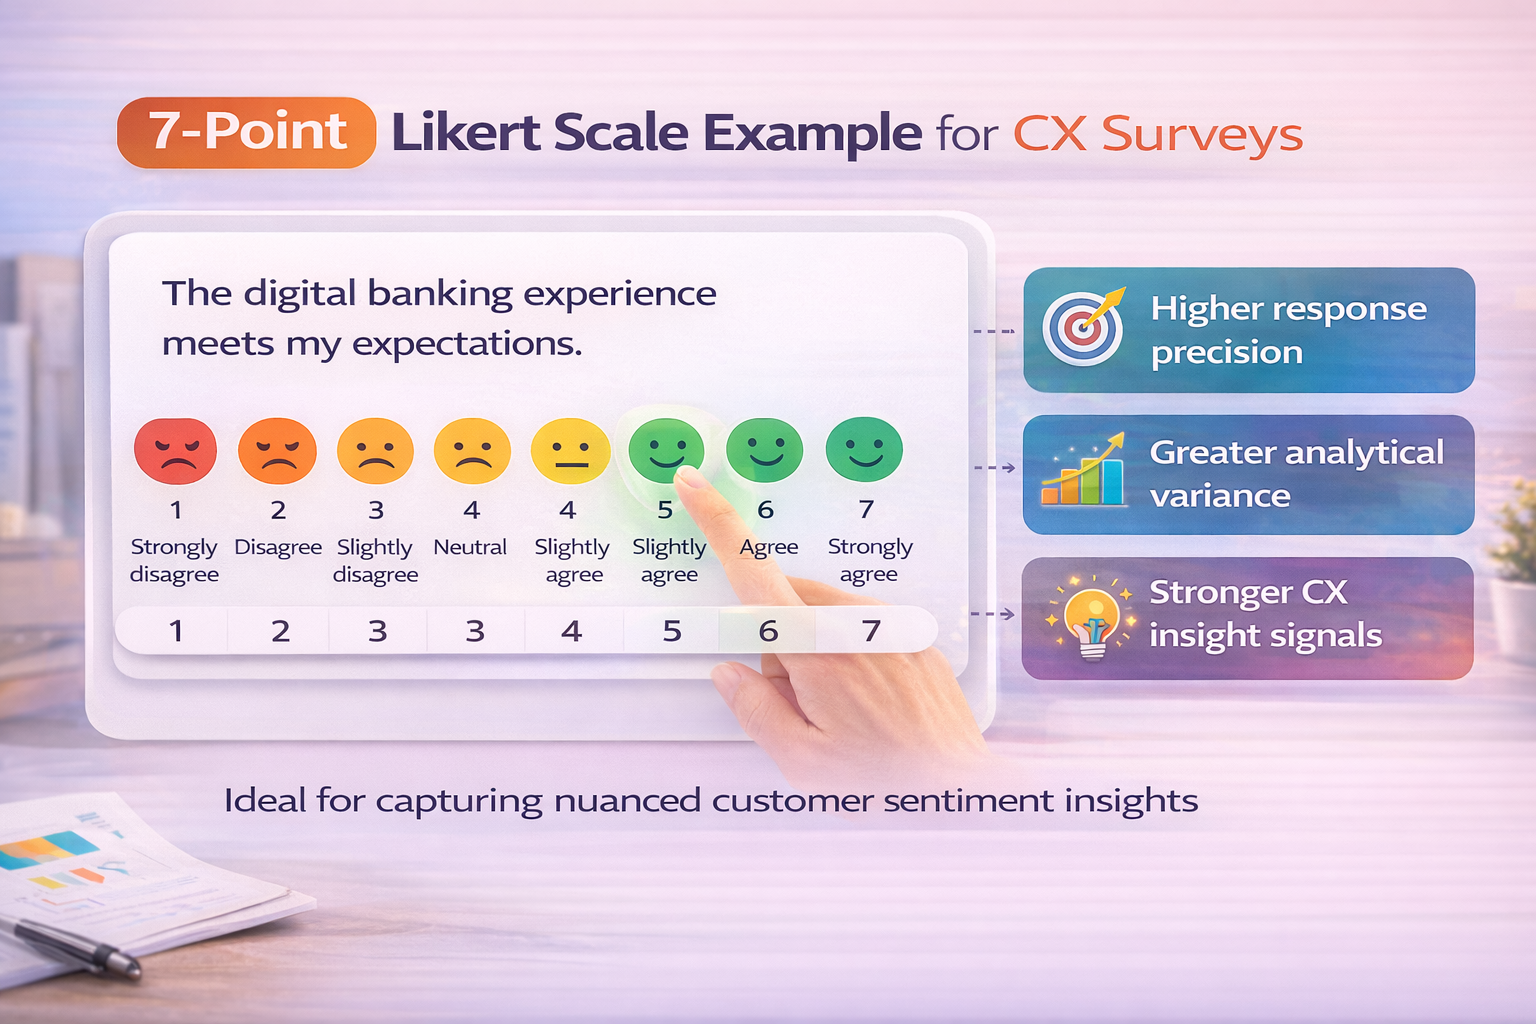
Now imagine you want to capture more subtle differences in customer sentiment. Your customers may not always feel simply satisfied or dissatisfied. Sometimes their experience sits somewhere in between slightly positive, slightly negative, or cautiously optimistic. This is where the 7-point Likert scale becomes useful.
Instead of five response options, the scale expands to seven levels, allowing customers to express more nuanced opinions.
Example
Statement: “The digital banking onboarding experience was easy to complete.”
Response options:
When you give customers these additional response choices, you allow them to express intensity more precisely. That additional granularity can make a meaningful difference when CX teams analyze experience signals across thousands of respondents.
In advanced CX analytics and customer research programs, richer data often leads to stronger insights. The 7-point Likert scale helps achieve this by providing greater response precision and stronger analytical depth.
1. Greater response precision
Customers can express subtle sentiment differences rather than clustering around the middle of a scale.
2. Improved statistical reliability
Survey research shows that reliability improves when response options increase from five to seven. Studies indicate Cronbach’s alpha rising from about 0.78 to approximately 0.85, reflecting a noticeable improvement in measurement reliability.
3. Stronger analytical signals
Seven-point scales also generate around 23% higher response variance, which improves the sensitivity of CX analytics models and helps identify subtle experience shifts across customer segments. This is particularly valuable when survey data supports analytics systems that analyze patterns in customer sentiment and journey behavior.
As survey methodology research explains:
“Seven-point Likert scales provide higher reliability and improved response variance, enabling deeper analytical sensitivity in survey data.”
– LikertAI Survey Research Analysis
For organizations that use advanced CX analytics platforms, that extra variance can strengthen customer intelligence models that analyze customer experience signals alongside behavioral and operational data.
While the 7-point scale improves analytical depth, it also introduces additional effort for respondents. More response options mean customers need slightly more time to interpret the scale and choose an answer. Research shows that response time increases by about 43% per question, and completion rates may drop to around 79% compared with roughly 87% for 5-point scales.
In other words:
This trade-off is why CX teams rarely treat scale selection as a purely methodological choice. Instead, they evaluate how survey data will be used downstream in analytics systems. If the goal is high-volume sentiment tracking across customer journeys, the simpler scale often works well. But if your surveys support advanced CX analytics models that analyze fine sentiment shifts, the additional granularity of the 7-point scale may provide stronger analytical signals. Understanding that balance is key to designing surveys that generate actionable CX insights rather than simply collecting more data.
Once you understand how both scales work, the next question becomes practical: Which scale actually performs better for CX programs and advanced CX analytics environments? The answer depends on what your CX team prioritizes. If your goal is maximum response volume and fast feedback, the 5-point scale is usually the better choice. If your goal is higher measurement precision and stronger analytical signals, the 7-point scale often performs better. The difference may seem small, but when thousands of responses feed CX analytics dashboards or customer intelligence systems, even small changes in measurement design can influence insights. In other words, the decision is not about which scale is universally better. Instead, the real question CX leaders should ask is:
Do we need faster feedback collection, or deeper experience signals for advanced analytics? That strategic choice determines which Likert scale will generate the most valuable data for your CX program.
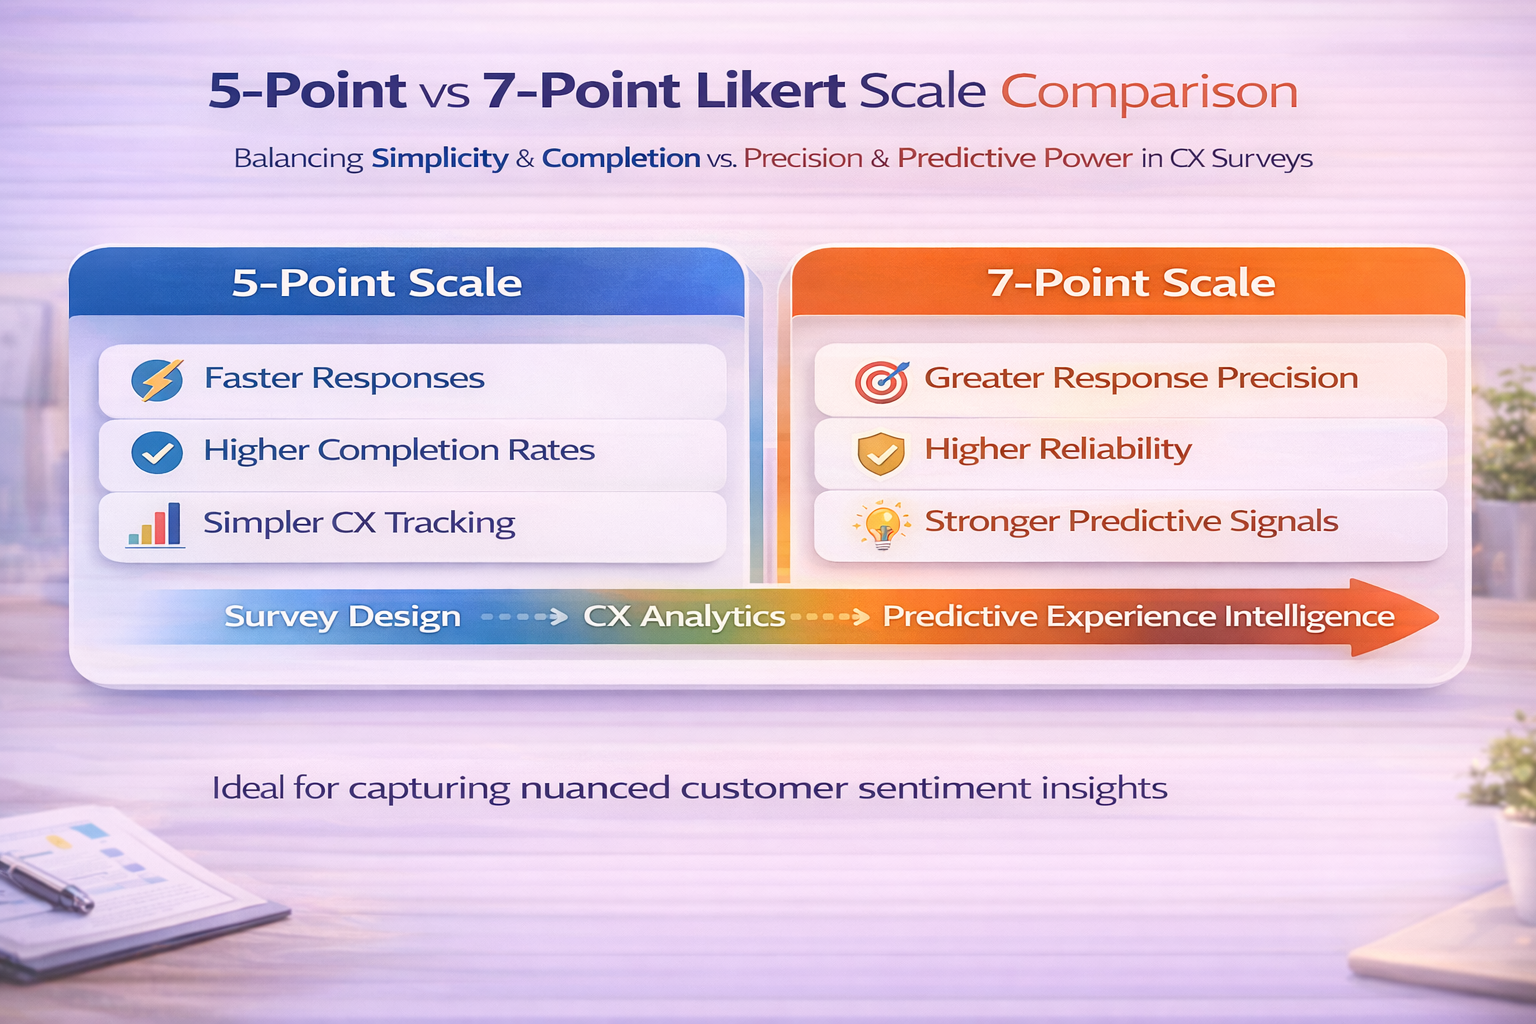
Below is a simplified comparison showing how the two scales typically perform.
Research shows that 7-point scales improve reliability by roughly 9–15% compared with 5-point scales, while also increasing response variance that can improve analytical sensitivity. However, this increased precision comes with a trade-off. Because respondents must evaluate more response options, surveys using seven-point scales often require about 43% more response time per question, which can slightly reduce completion rates.
If your organization runs large-scale customer experience programs, the higher completion rates of the 5-point scale can produce larger datasets and faster feedback cycles.But if your surveys feed advanced CX analytics programs, the extra variance from the 7-point scale may improve how analytics systems interpret sentiment changes across customer journeys.
In other words, the decision is not about which scale is universally better. Instead, the real question CX leaders should ask is: Do we need faster feedback collection, or deeper experience signals for advanced customer experience analysis? That strategic choice determines which Likert scale will generate the most valuable data for your CX program.
By now you’ve probably realized something important: there isn’t a universal “best” Likert scale. The right choice depends on what your CX program is trying to achieve and how the data will be used downstream.
When we design surveys for customer experience measurement, the scale decision usually comes down to a simple trade-off: speed vs precision.
Some CX programs need large volumes of fast feedback, while others require high-precision experience signals that support deeper analytics and customer experience research. Understanding this distinction helps CX leaders select the right scale for their research goals.
The 5-point Likert scale works well when your primary objective is collecting feedback quickly and at scale.
You should consider using a 5-point scale when:
• You are running high-volume CX surveys across large customer bases
• Your priority is maximizing completion rates
• You want simple sentiment tracking across journeys
• Your surveys are short post-interaction or transactional feedback surveys
Because the scale is easy to interpret, customers respond quickly, which helps organizations gather larger datasets for CX monitoring. Research benchmarks show that 5-point scales often achieve completion rates close to 87%, making them highly effective for ongoing customer feedback programs. For many CX teams, this high response volume is critical for tracking experience trends across touchpoints such as onboarding, service interactions, or digital product usage.
In other situations, CX teams need greater analytical depth rather than faster responses. This is where the 7-point Likert scale can provide stronger insight.
You should consider using a 7-point scale when:
• Your surveys feed advanced CX analytics, customer intelligence, or journey analytics programs• You want to detect small changes in sentiment over time
• Your research focuses on product experience or digital journey analysis
• Your team needs more granular customer feedback signals
Because respondents have more response options, the 7-point scale captures subtle variations in perception and satisfaction. Studies show that seven-point scales produce around 23% higher response variance, which helps analytics systems detect patterns more accurately. This additional signal strength becomes especially valuable when organizations combine survey responses with behavioral data, operational metrics, and journey analytics.
For CX leaders and insights teams, the real decision is not simply about survey design. The decision is about how survey data will power your customer intelligence ecosystem. If surveys are primarily used for high-level CX tracking, a 5-point scale often performs best.
But if your organization is building advanced CX analytics programs, the additional signal depth from a 7-point scale can improve customer insight generation and journey analysis.
Many modern CX analytics ecosystems combine survey signals with behavioral data to identify friction, understand sentiment patterns, and improve customer journey visibility. In these environments, survey scale design becomes part of the analytics strategy itself. Choosing the right Likert scale is therefore not just a methodological decision, it is a strategic decision about how your organization captures and interprets customer experience signals.
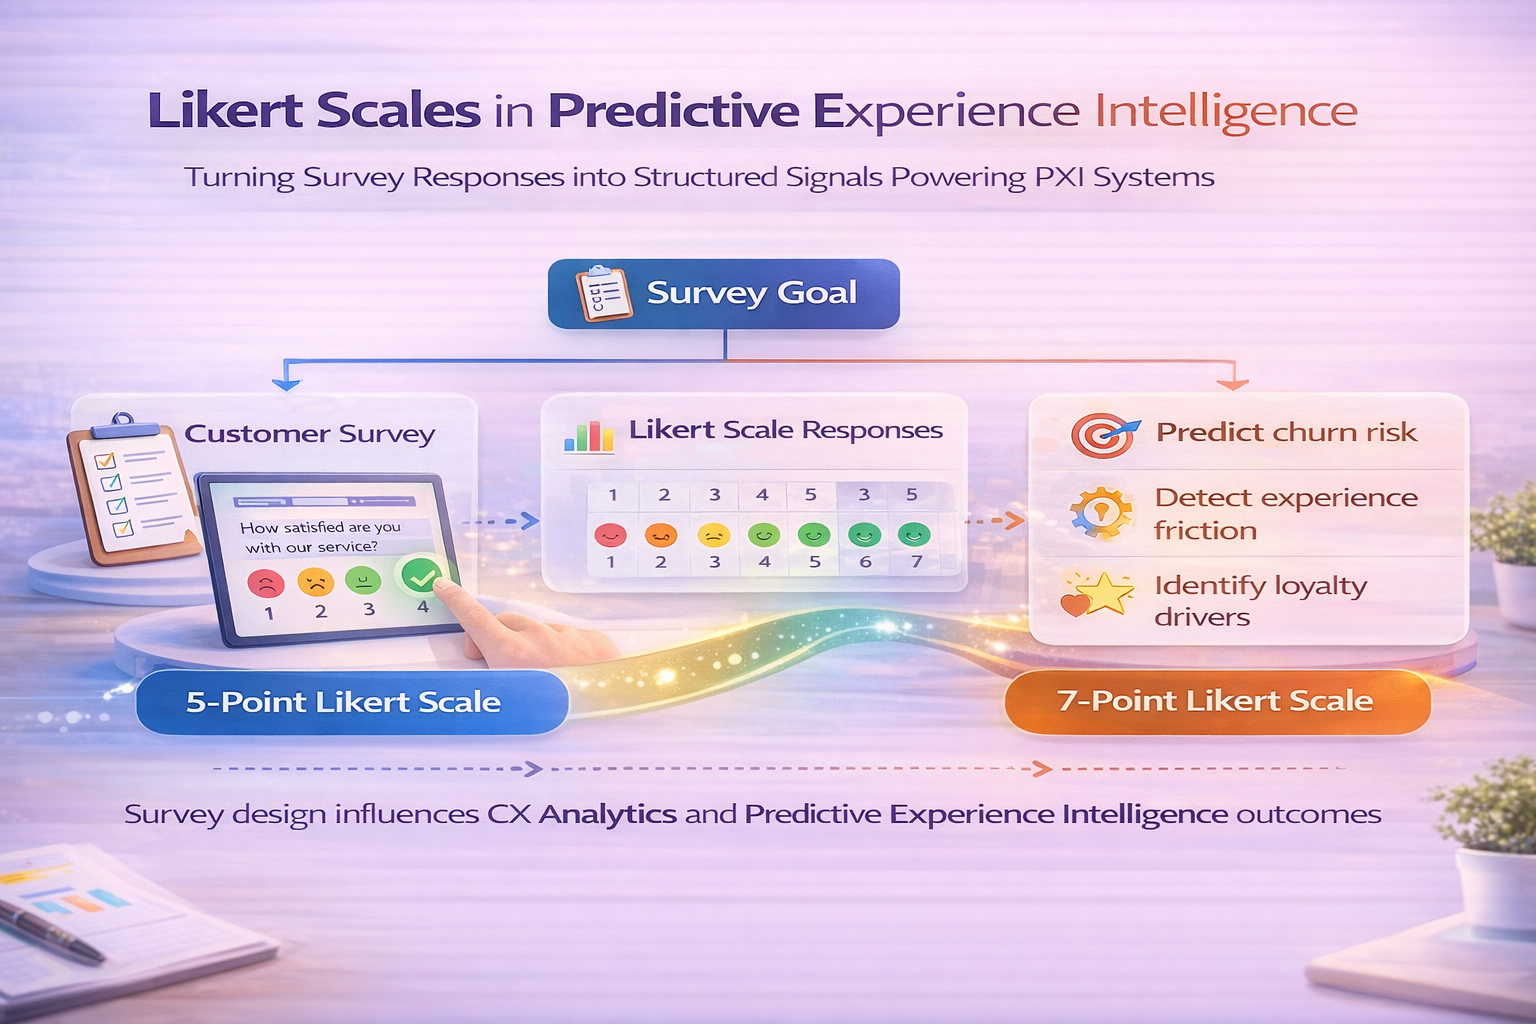
For many organizations today, surveys are no longer just feedback tools. They are becoming structured data inputs for advanced customer experience analytics.
In modern CX programs, survey responses are often combined with:
This combination allows organizations to move beyond simple satisfaction measurement and toward more advanced customer experience analytics and operational intelligence. In modern CX analytics systems, Likert scale responses act as structured sentiment signals. These signals help analytics platforms understand how customers perceive experiences across journeys and interactions.
For example, a CX analytics system may combine survey feedback with behavioral signals to answer questions such as:
The accuracy of those insights depends heavily on how precisely survey responses capture customer sentiment.
When CX analytics models analyze survey data, they rely on variance in responses to detect patterns. If responses cluster too closely around the same values, analytics systems have fewer signals available for identifying meaningful patterns. This is where the difference between 5-point vs 7-point Likert scales becomes relevant.
A 5-point scale tends to group responses into broader sentiment categories. This works well for tracking overall satisfaction trends across large customer populations. A 7-point scale, however, introduces more response variation. That additional variation allows analytics models to detect subtle shifts in sentiment and experience perception. Research shows that 7-point scales generate approximately 23% more response variance, improving analytical sensitivity in survey-based models.
This additional signal strength can improve how analytics systems identify:
Organizations that combine survey responses with behavioral analytics can transform traditional feedback programs into continuous experience intelligence systems.
Instead of simply reporting survey scores, CX teams can:
This approach is becoming increasingly important in industries such as banking, retail, insurance, and digital services where customer experience signals change rapidly and competitive differentiation depends on understanding those signals early. Modern CX analytics platforms focus on converting survey responses into actionable customer intelligence signals that improve visibility across customer journeys and operational workflows.
By combining survey analytics, behavioral insights, and operational data, these systems help organizations understand not only what customers say, but also how customer experience patterns evolve across journeys. In this context, the choice between a 5-point vs 7-point Likert scale becomes more than a survey design preference. It becomes a data architecture decision that affects how effectively customer experience signals support deeper CX analytics.
Designing the right Likert scale for CX surveys is only the first step.
The real value comes when customer feedback is transformed into actionable experience intelligence. Modern CX teams need more than survey dashboards; they need systems that connect feedback with behavioral signals, journey analytics, and customer intelligence insights.
With modern CX analytics frameworks, organizations can:
Modern CX analytics platforms combine survey signals, behavioral data, and operational metrics to reveal the real drivers of customer experience and operational performance. If your organization wants to move beyond traditional feedback reporting and start generating deeper operational CX insights from experience signals, the next step is exploring how modern CX analytics can support your program.
Schedule a demo to see how modern CX analytics transforms customer feedback into actionable operational insights.
A 5-point Likert scale uses five response options ranging from strongly disagree to strongly agree, while a 7-point Likert scale expands the response range with additional options such as slightly agree or slightly disagree. The 5-point scale prioritizes simplicity and higher response rates, while the 7-point scale provides greater response precision and analytical sensitivity.
The best scale depends on the goal of the survey. A 5-point scale is often better for large-scale CX surveys where completion rates and quick feedback are important. A 7-point scale is useful when organizations want more nuanced sentiment signals, particularly when survey data feeds into advanced CX analytics, customer intelligence systems, or journey analytics programs.
Research shows that 7-point scales generally produce higher measurement reliability, often improving Cronbach’s alpha scores compared with 5-point scales. The additional response options increase variance in the data, which helps analytics models detect subtle changes in customer sentiment.
Likert scale responses convert customer perceptions into structured data that can be analyzed by CX analytics platforms. When combined with behavioral and operational data, these responses help organizations identify patterns related to customer satisfaction, loyalty, engagement, and experience quality across journeys.
Many organizations continue using the 5-point scale because it is easy for respondents to understand and quick to complete. Higher completion rates produce larger datasets, which can be valuable for tracking overall customer experience trends across large customer populations.
.png)
.svg)


